Game 1 Recap
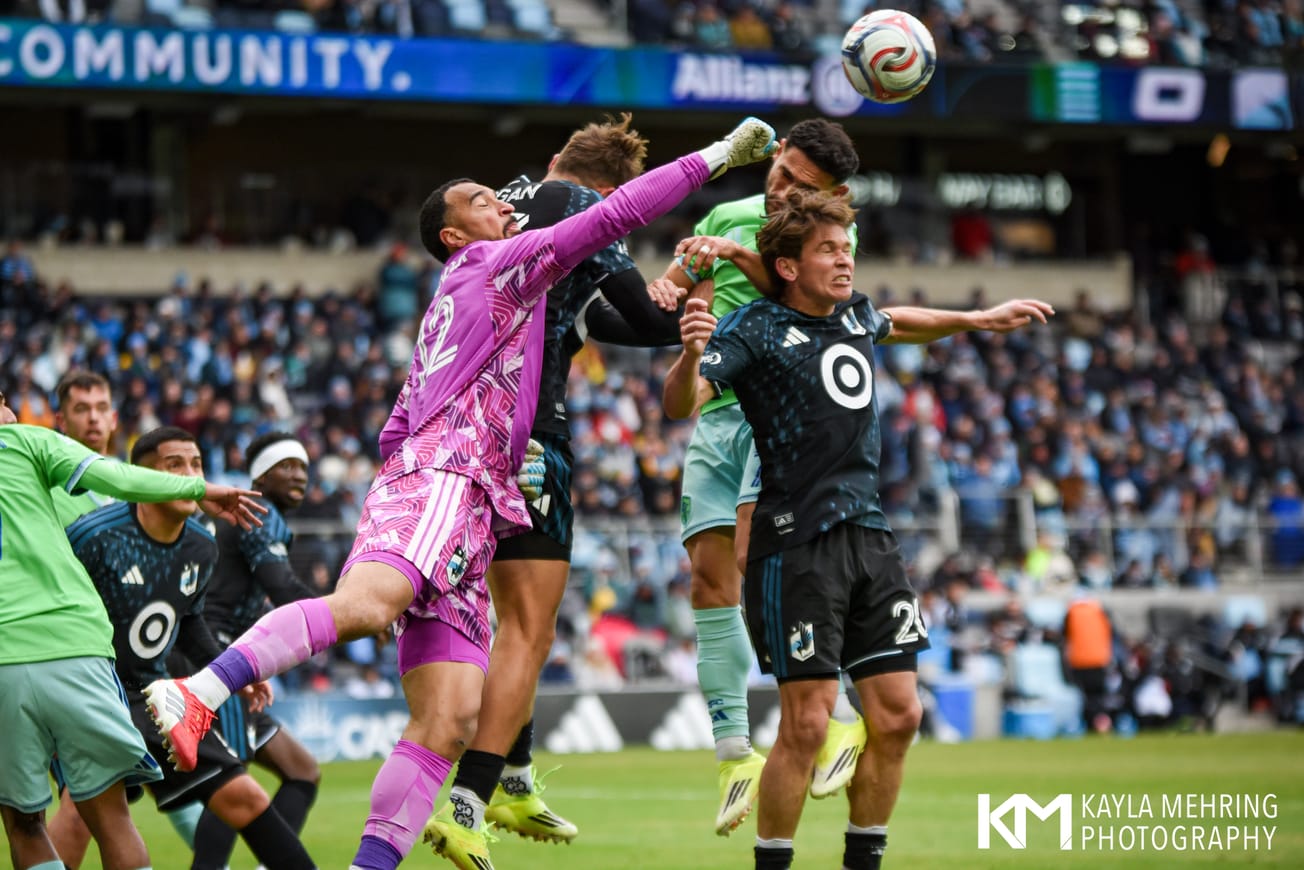
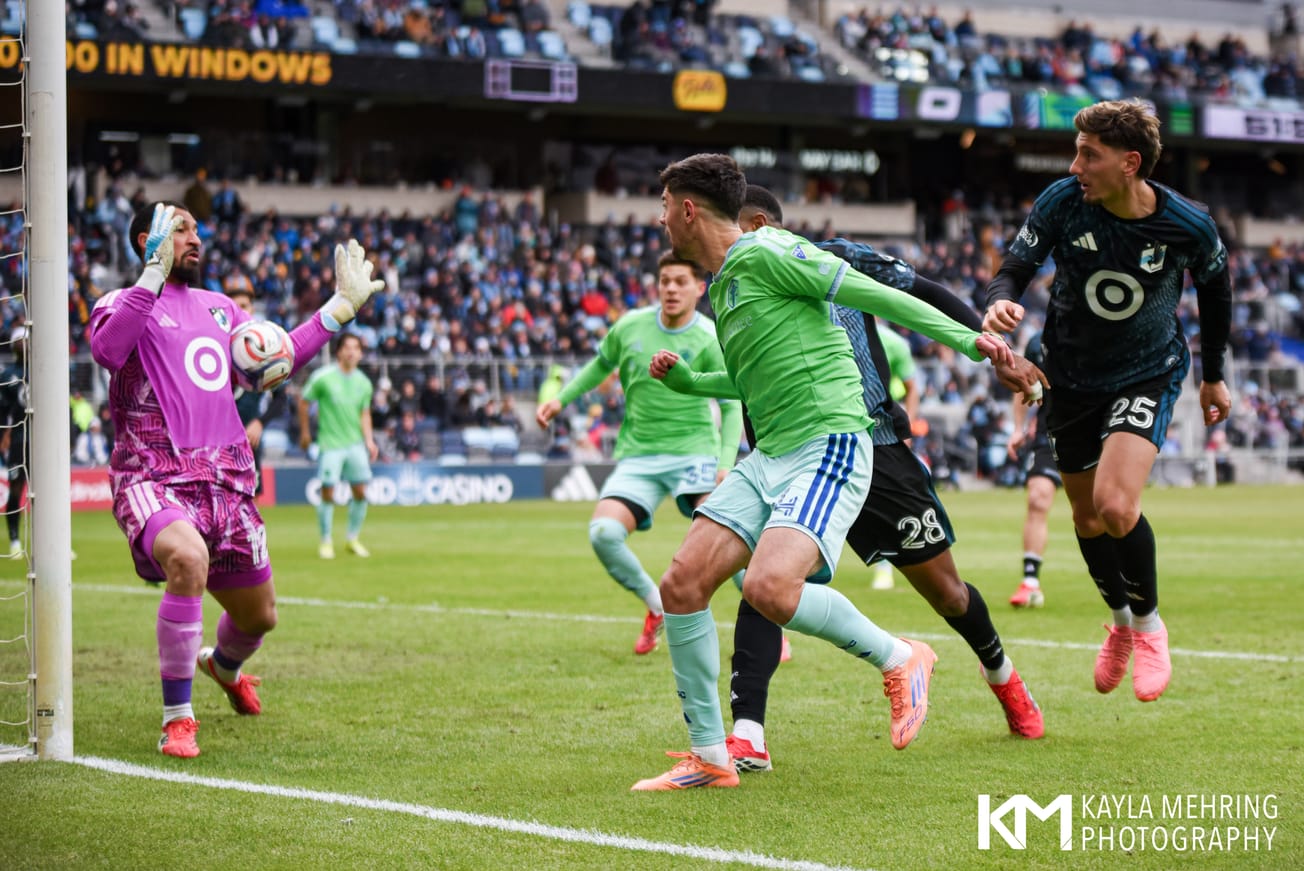
Seattle and Minnesota opened their playoff series with a clash of styles, the Sounders' fluid attacking play versus the Loons' compact counterattacking setup. Despite Seattle controlling nearly every phase of the game with 70% possession and 2.37 expected goals, the final product never came. Minnesota absorbed pressure, and ultimately held on to steal the result in penalties after a scoreless draw.
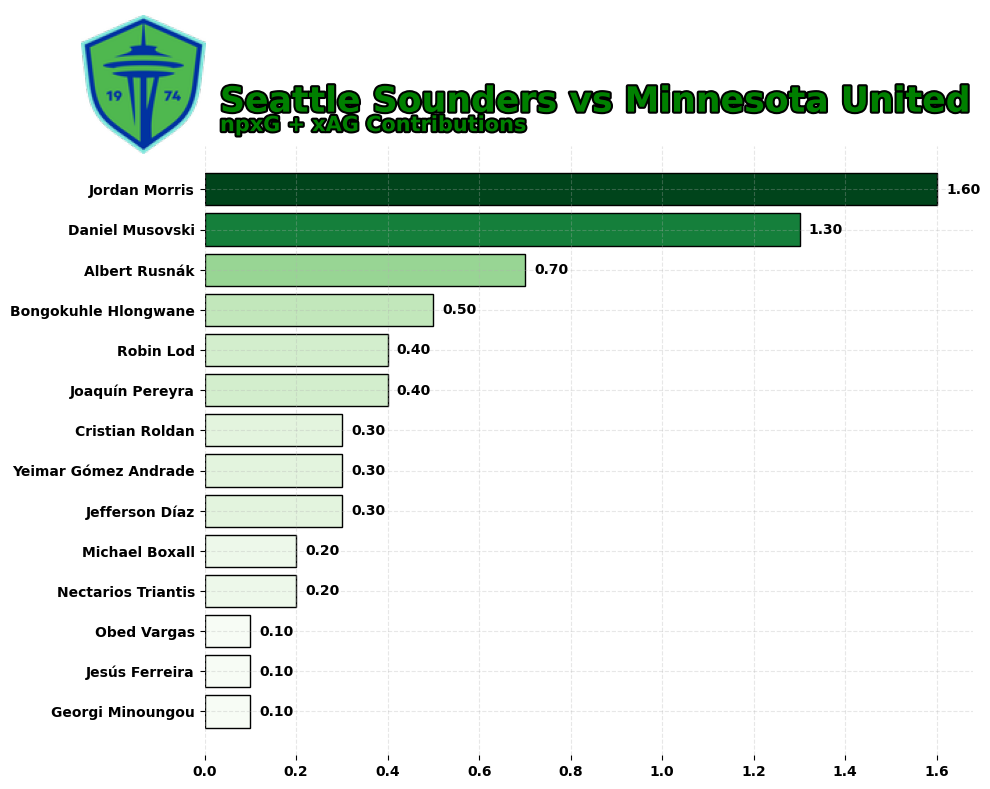
Statistically, this was a game the Sounders should have won. They created the better chances with Albert Rusnák, Cristian Roldan, Danny Musovski, and Jordan Morris leading the charge in progression and chance creation. Still, the night belonged to the Loons.

Game 1 Recap
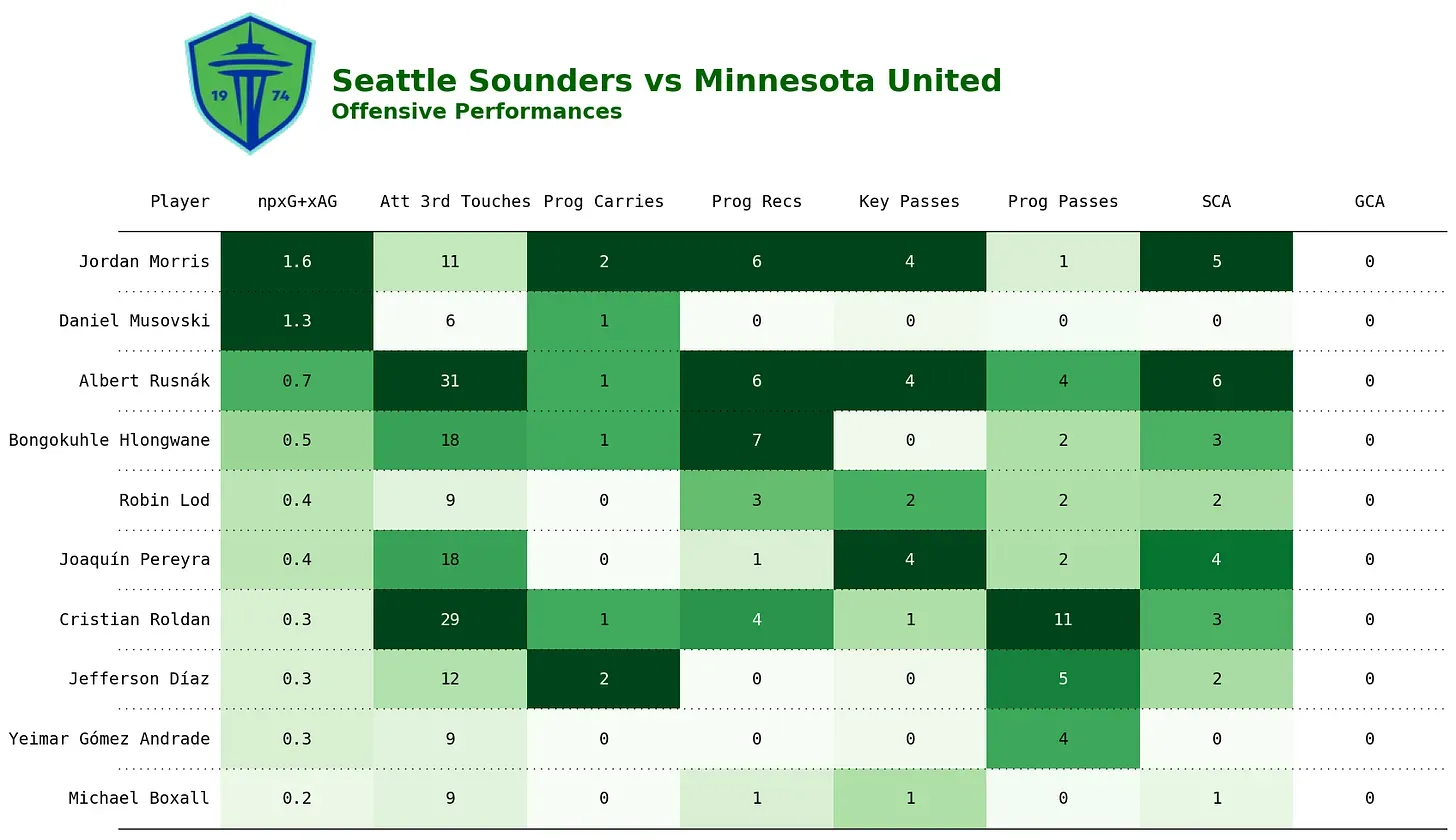
Game 1 Attacking Standout Performances
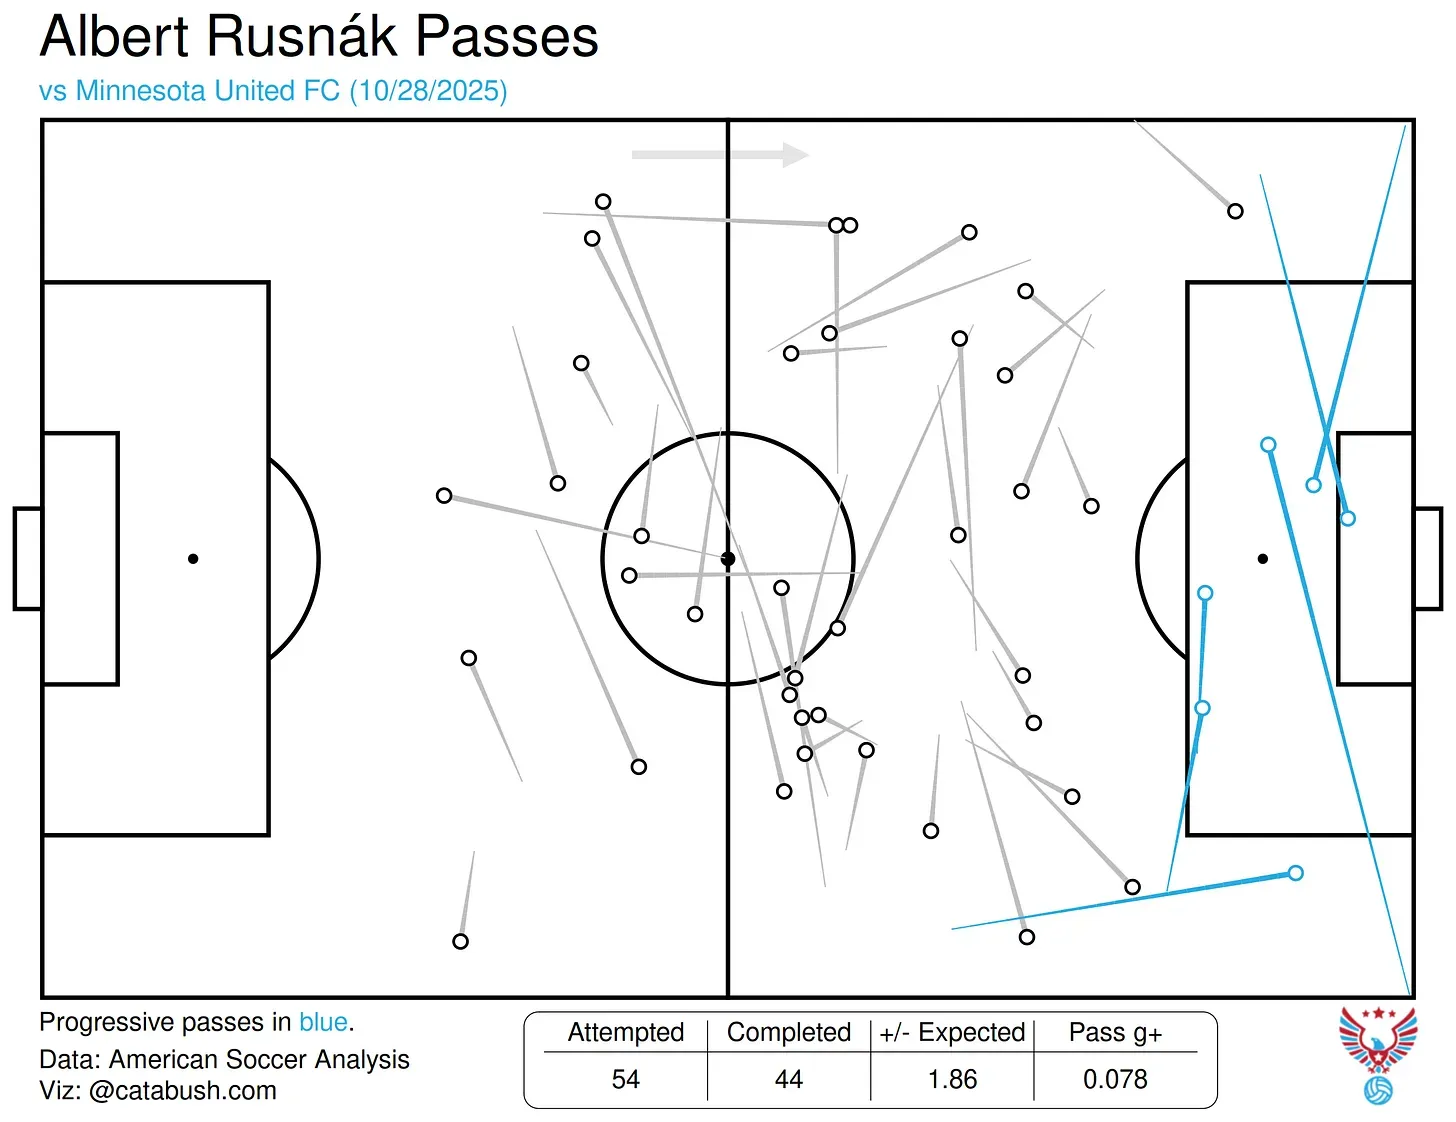
Albert Rusnák - 31 final-third touches, 6 progressive receptions, 4 key passes, 6 shot-creating actions.
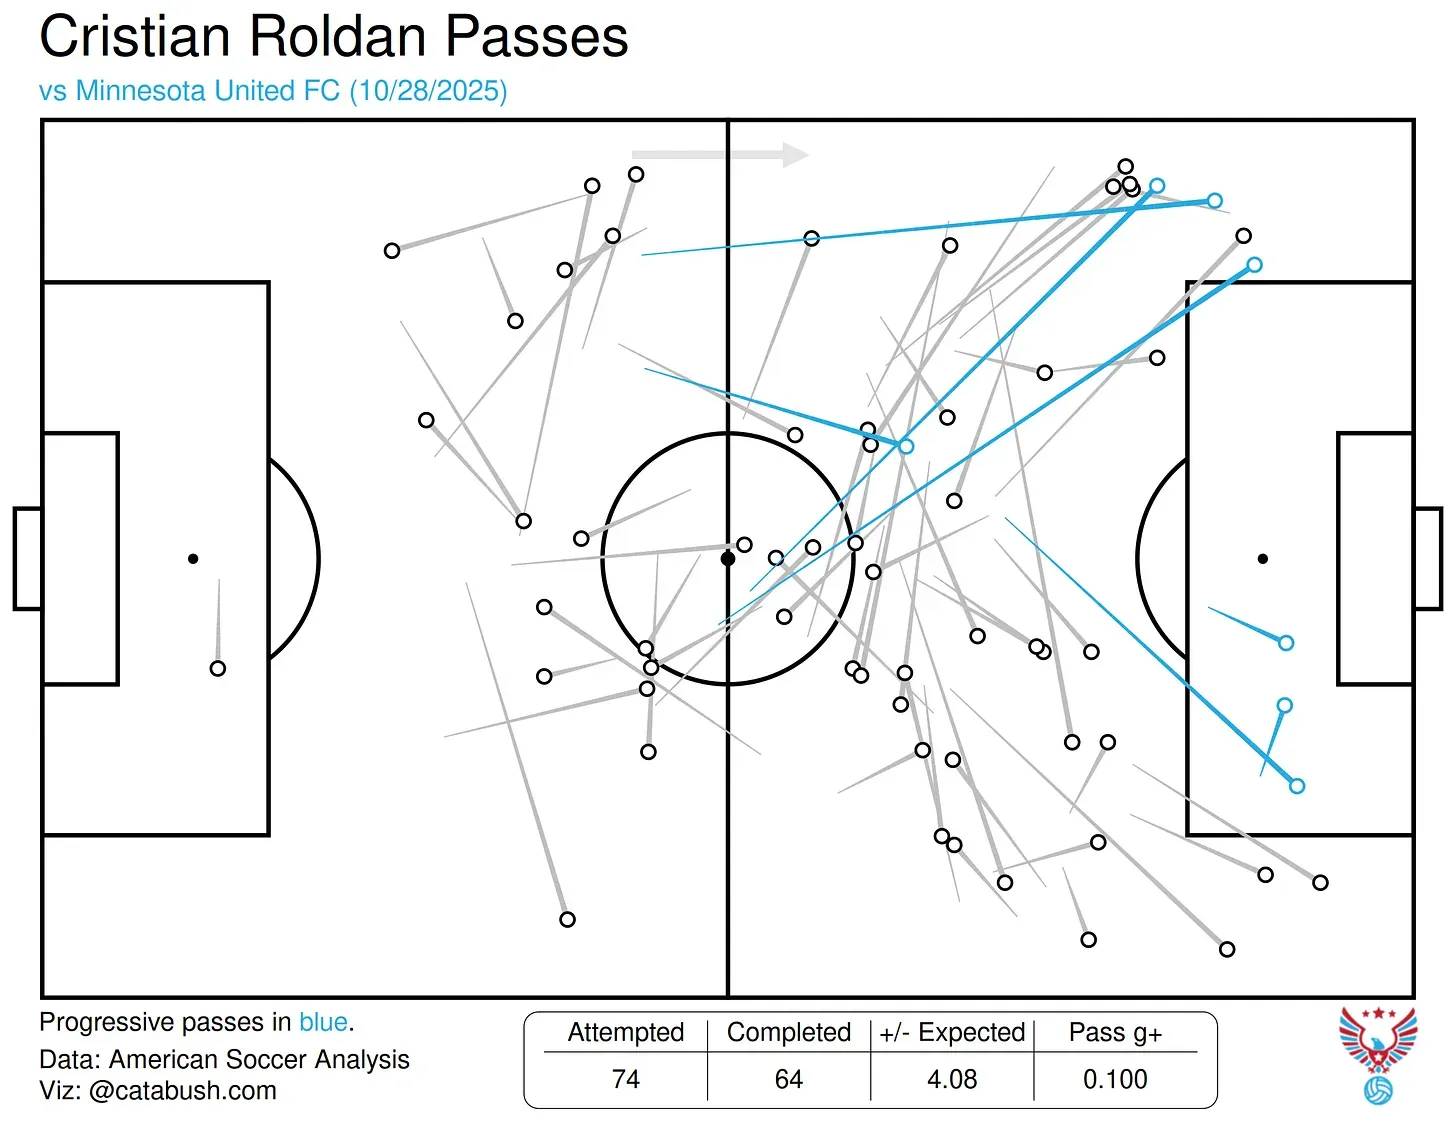
Cristian Roldan- 29 final third touches, 4 progressive receptions, 11 progressive passes, 3 shot-creating actions.
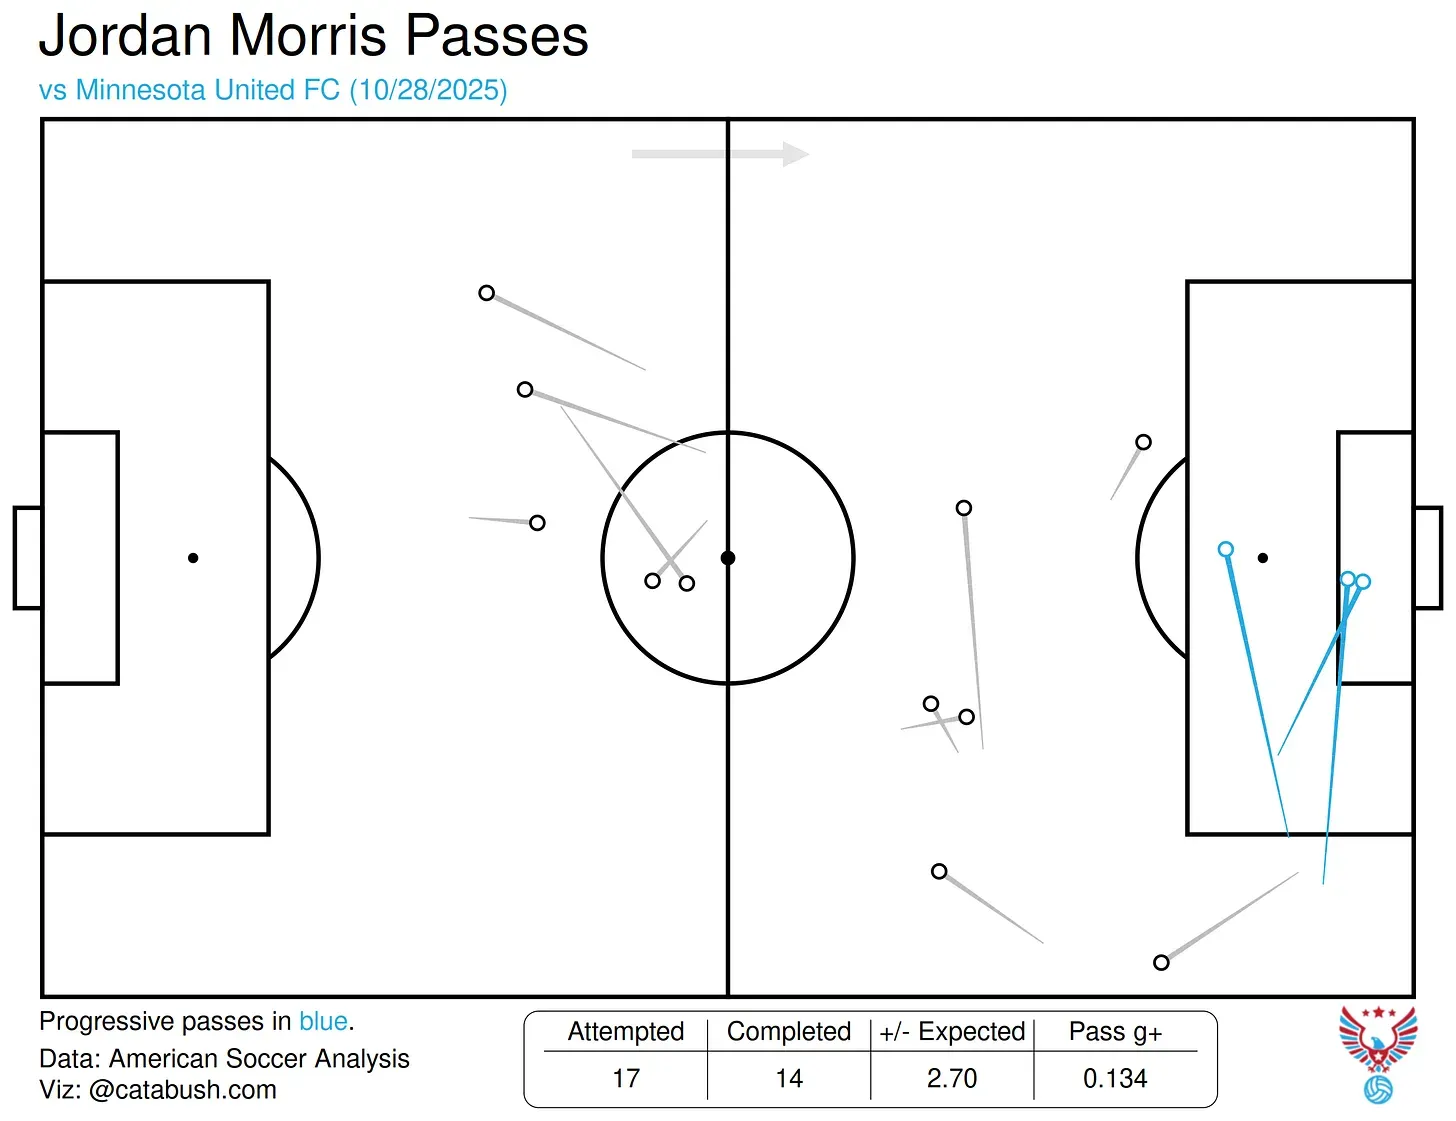
Jordan Morris- 2 progressive carries, 6 progressive receptions, 5 shot-creating actions
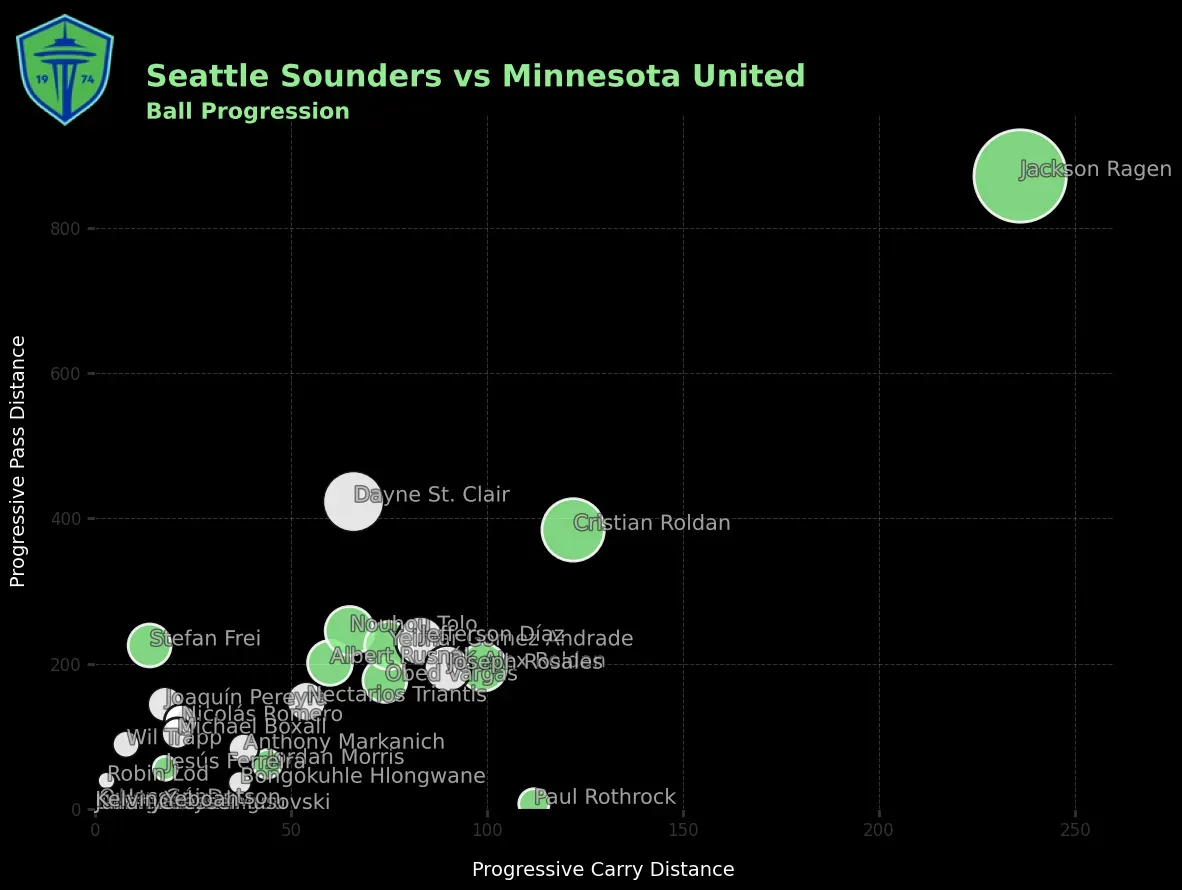
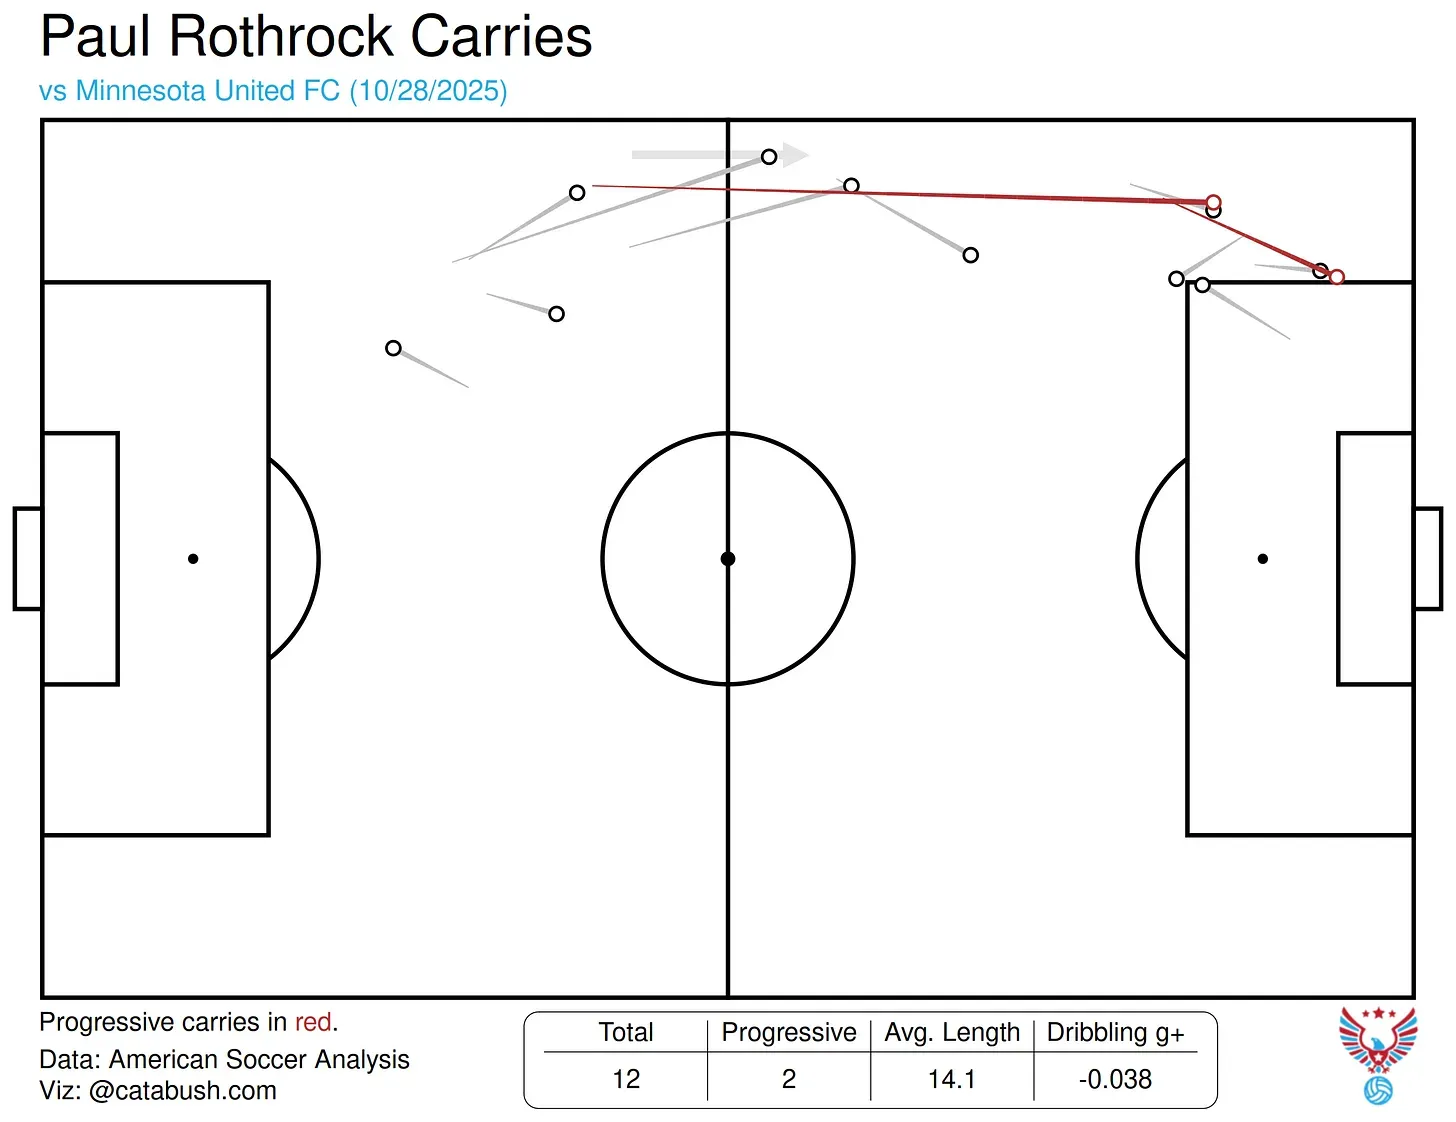
Paul Rothrock - 12 carries (2 progressive), 12 yards per carry on average
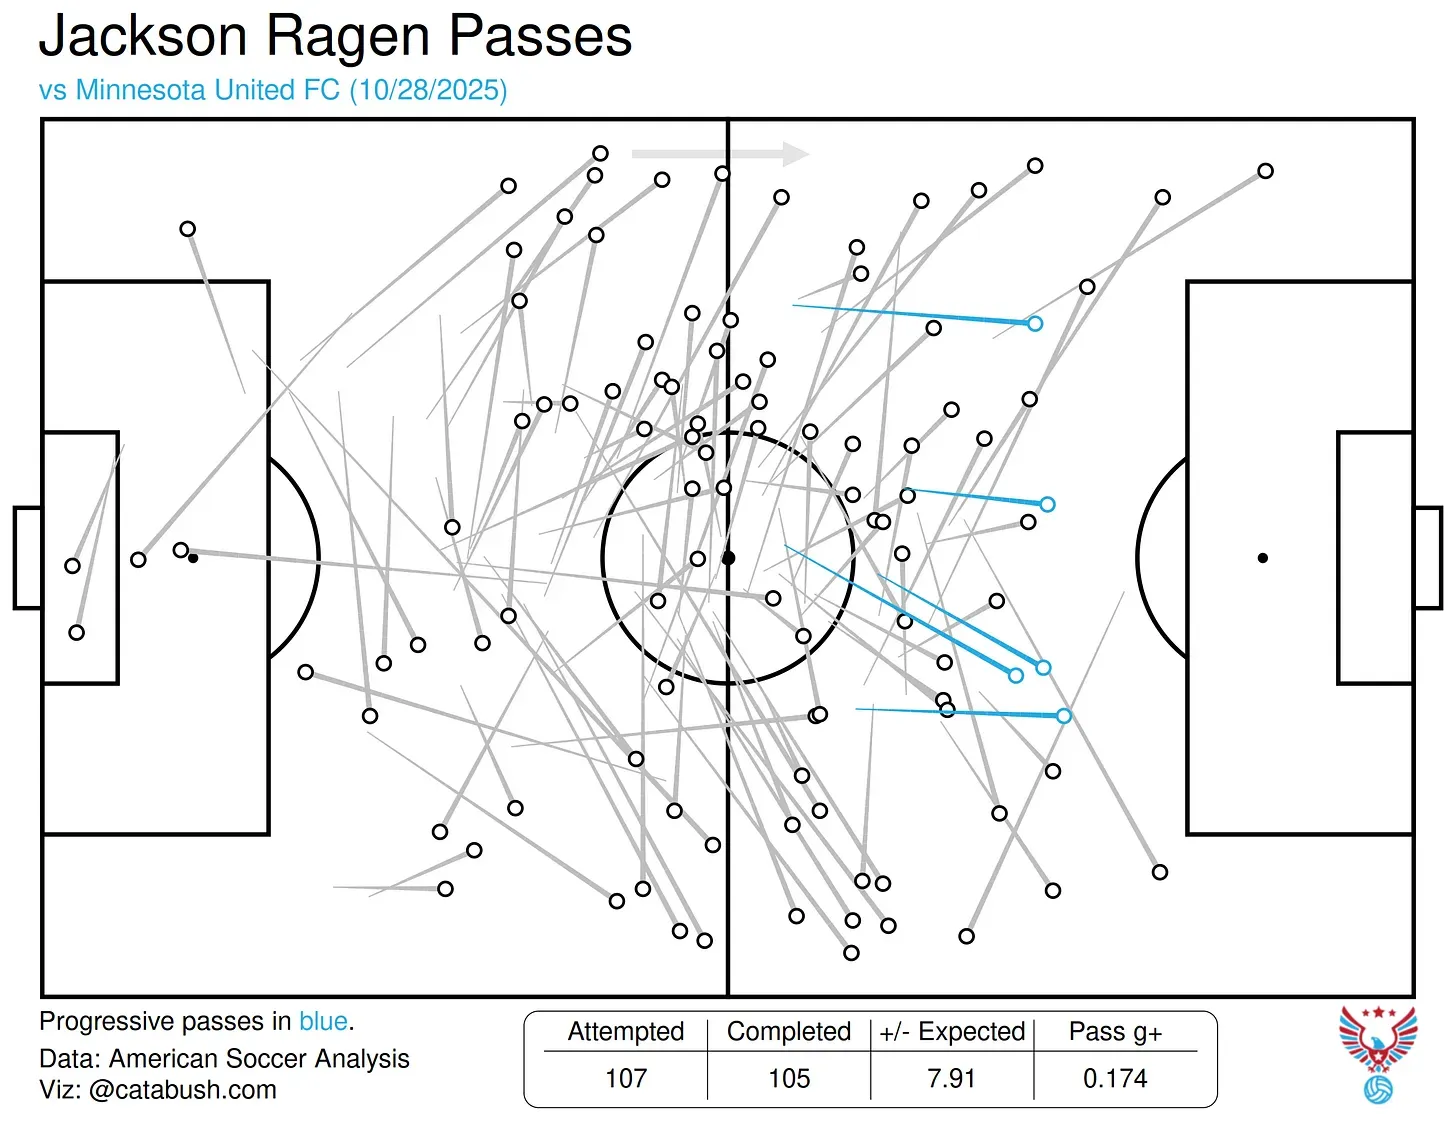
Jackson Ragen - 5 progressive passes into the final third
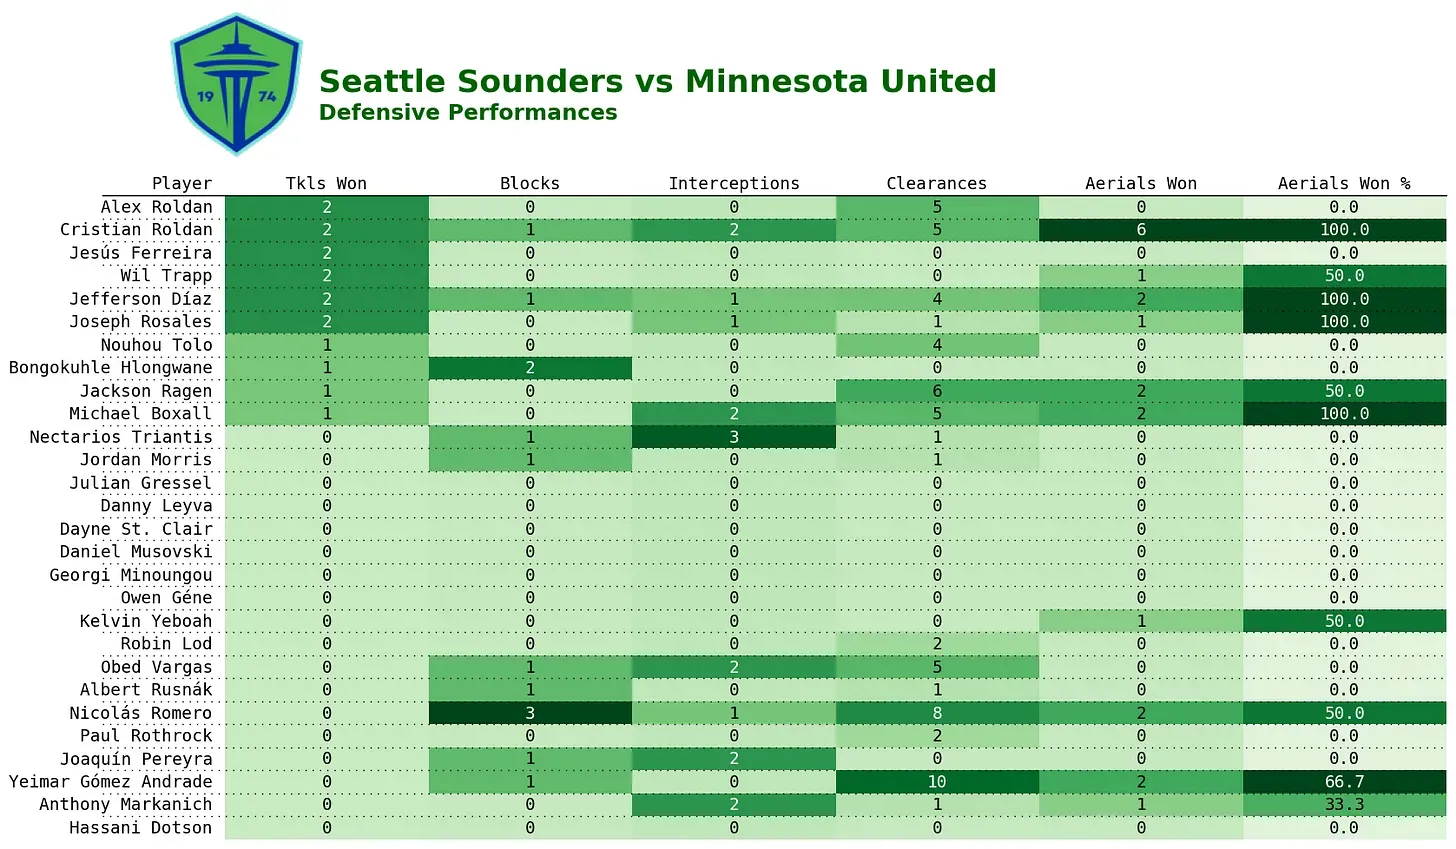
Game 1 Key Defensive Contributors
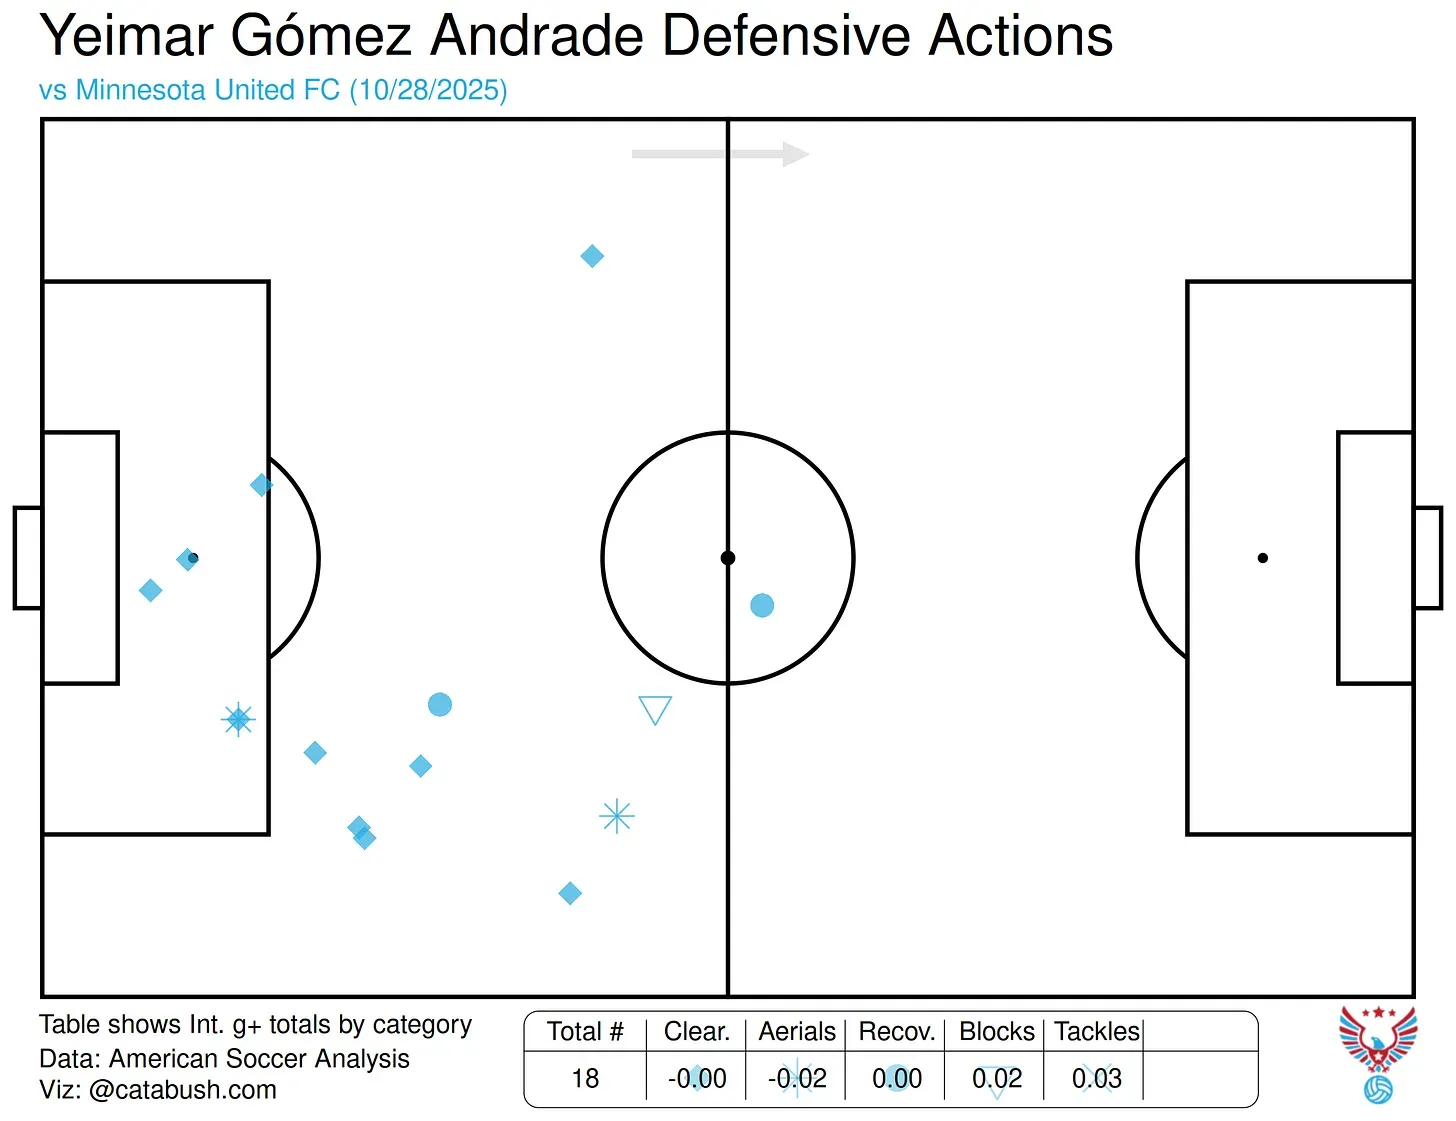
Yeimar - 10 clearances, 1 block, 2 aerial duels won
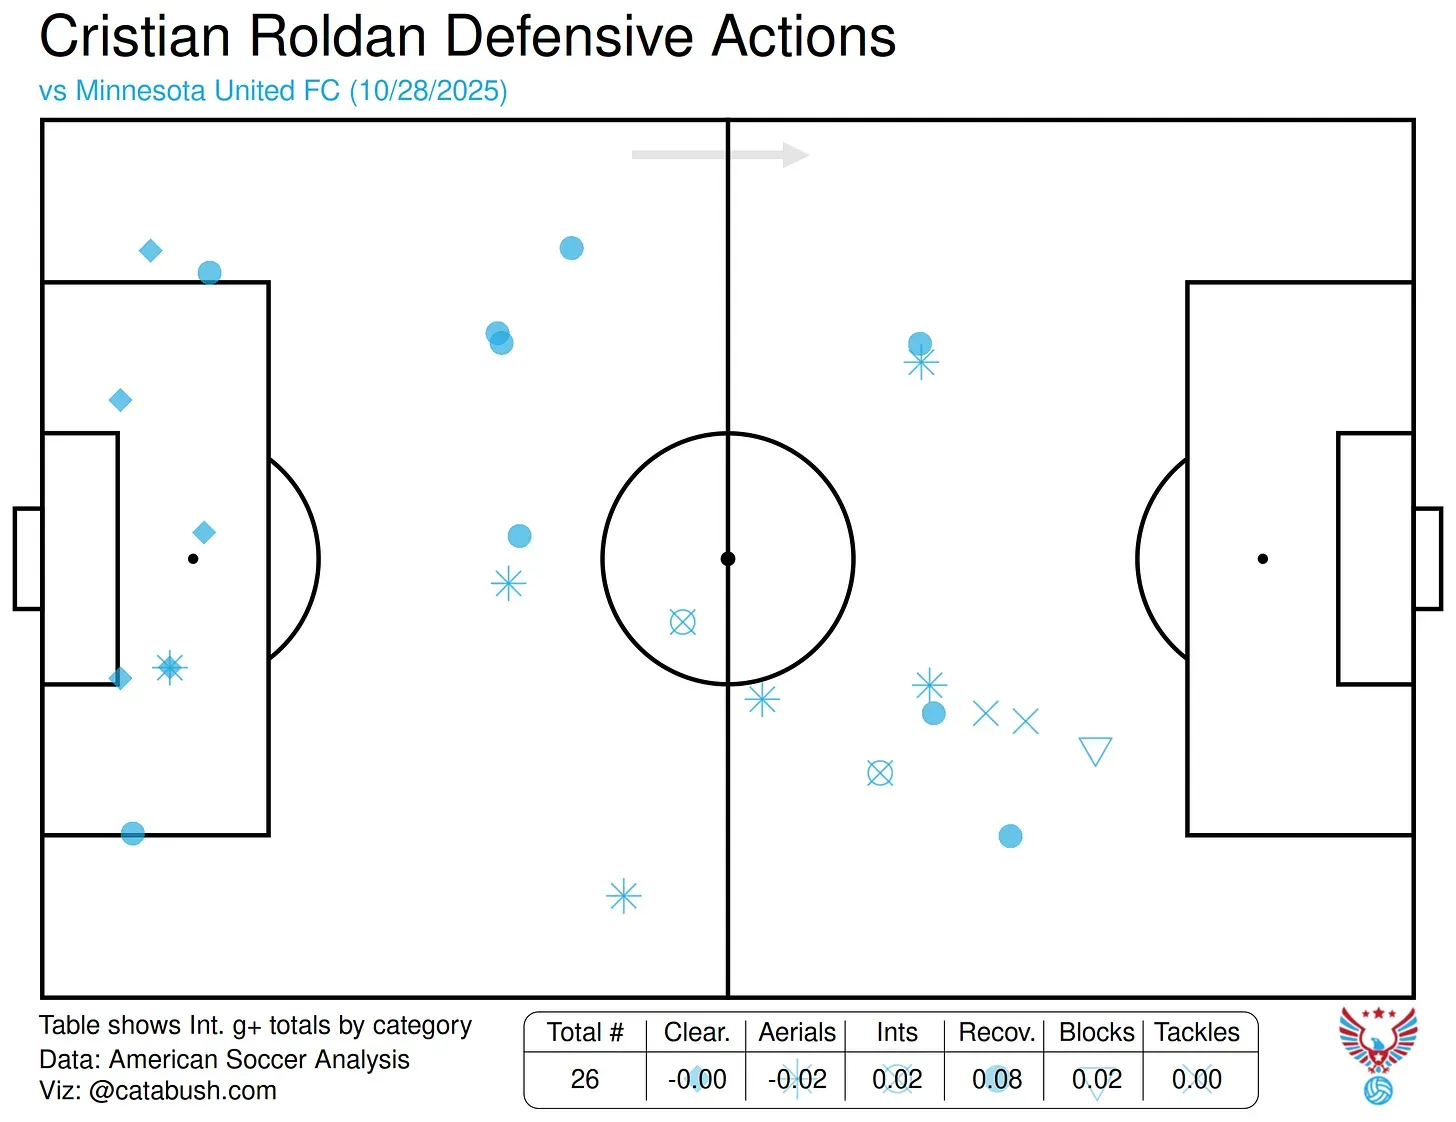
Christian Roldan - 2 tackles, 2 interceptions, 1 block, 5 clearances, 6 areal duels own (100% aerial success rate)
Head-to-Head Context
Including Game 1, the Sounders have now lost all three meetings with Minnesota this year. But while the results say one thing, the numbers tell a very different story. One that leaves me optimistic heading into Game 2.
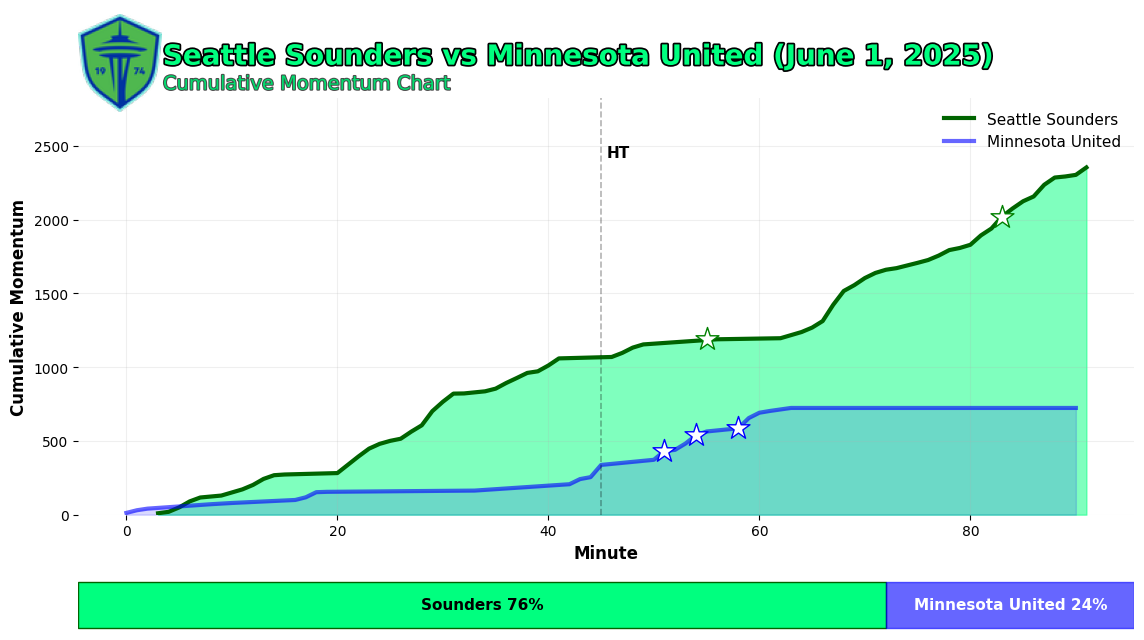
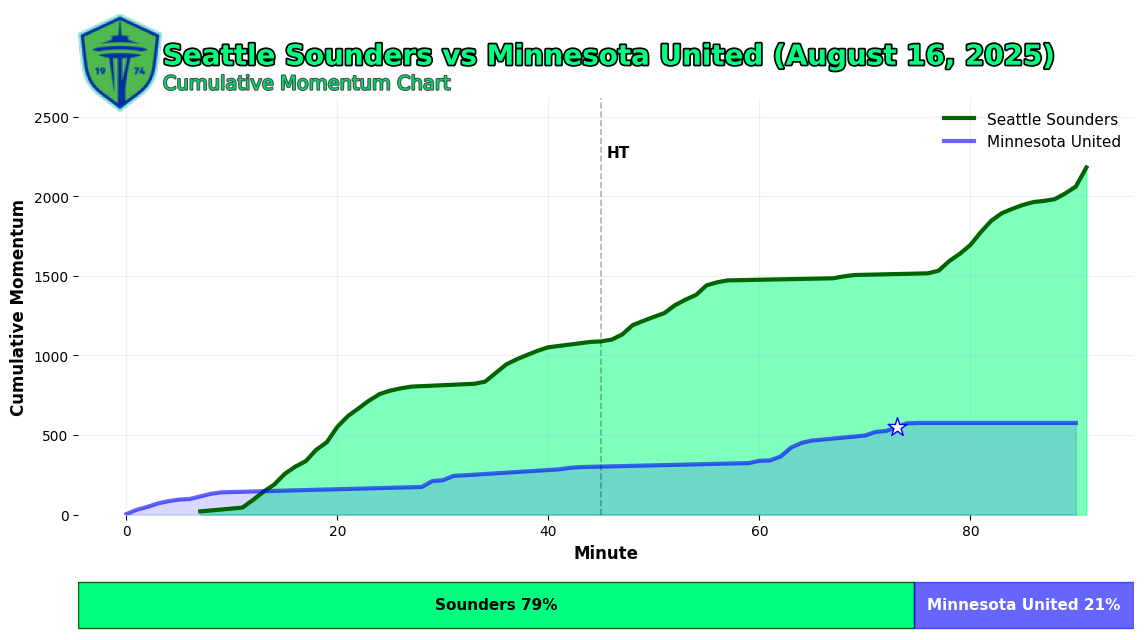
Across all three matches, Seattle dominated the ball and dictated the attacking tempo, holding over 75% of the attacking momentum* share in both regular-season matchups. The first meeting was particularly strange with four goals during a roughly 10-minute stretch. Both games followed a similar pattern. The Loons came away with the results and each time it felt like the Sounders were robbed.
Clash of Philosophies
The two teams approach the game in completely different ways. Seattle thrives on controlled possession, while Minnesota finds value in compact defending and explosive counterattacks.
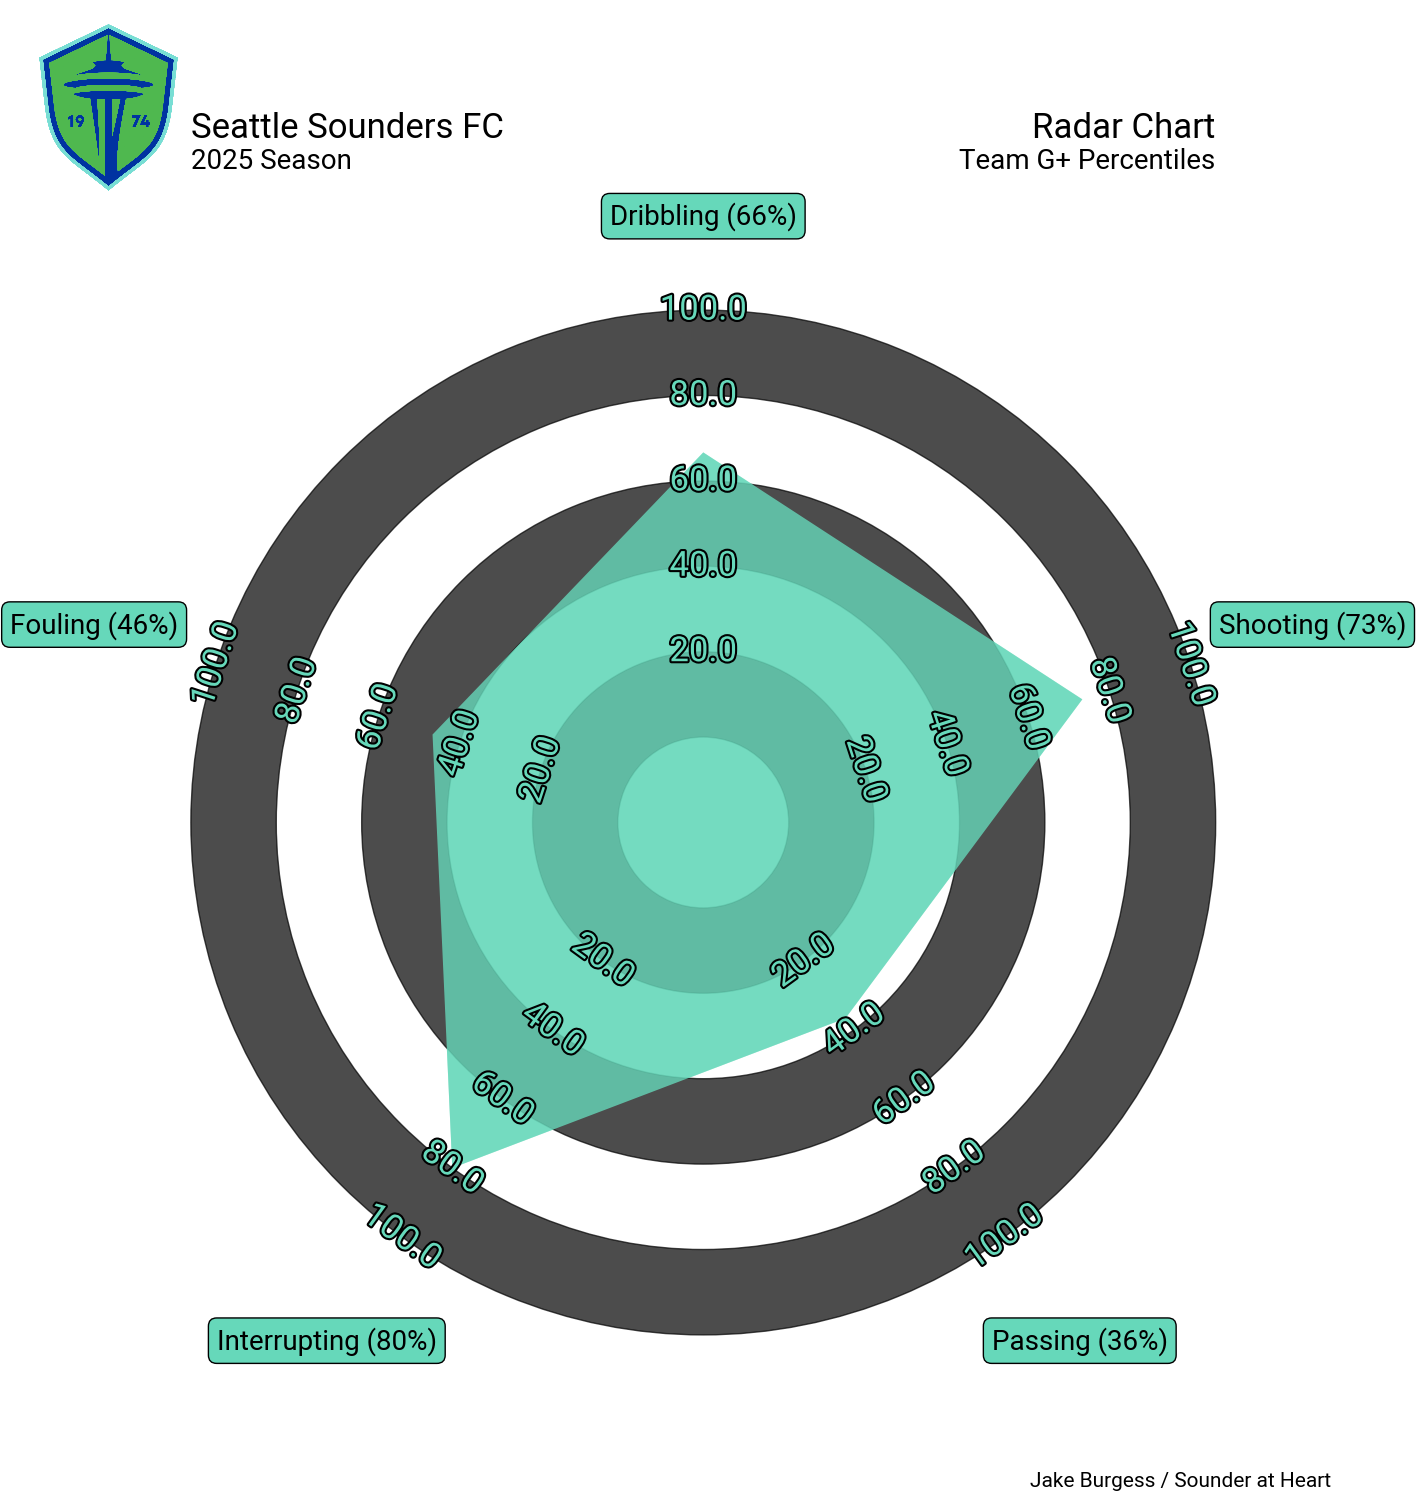
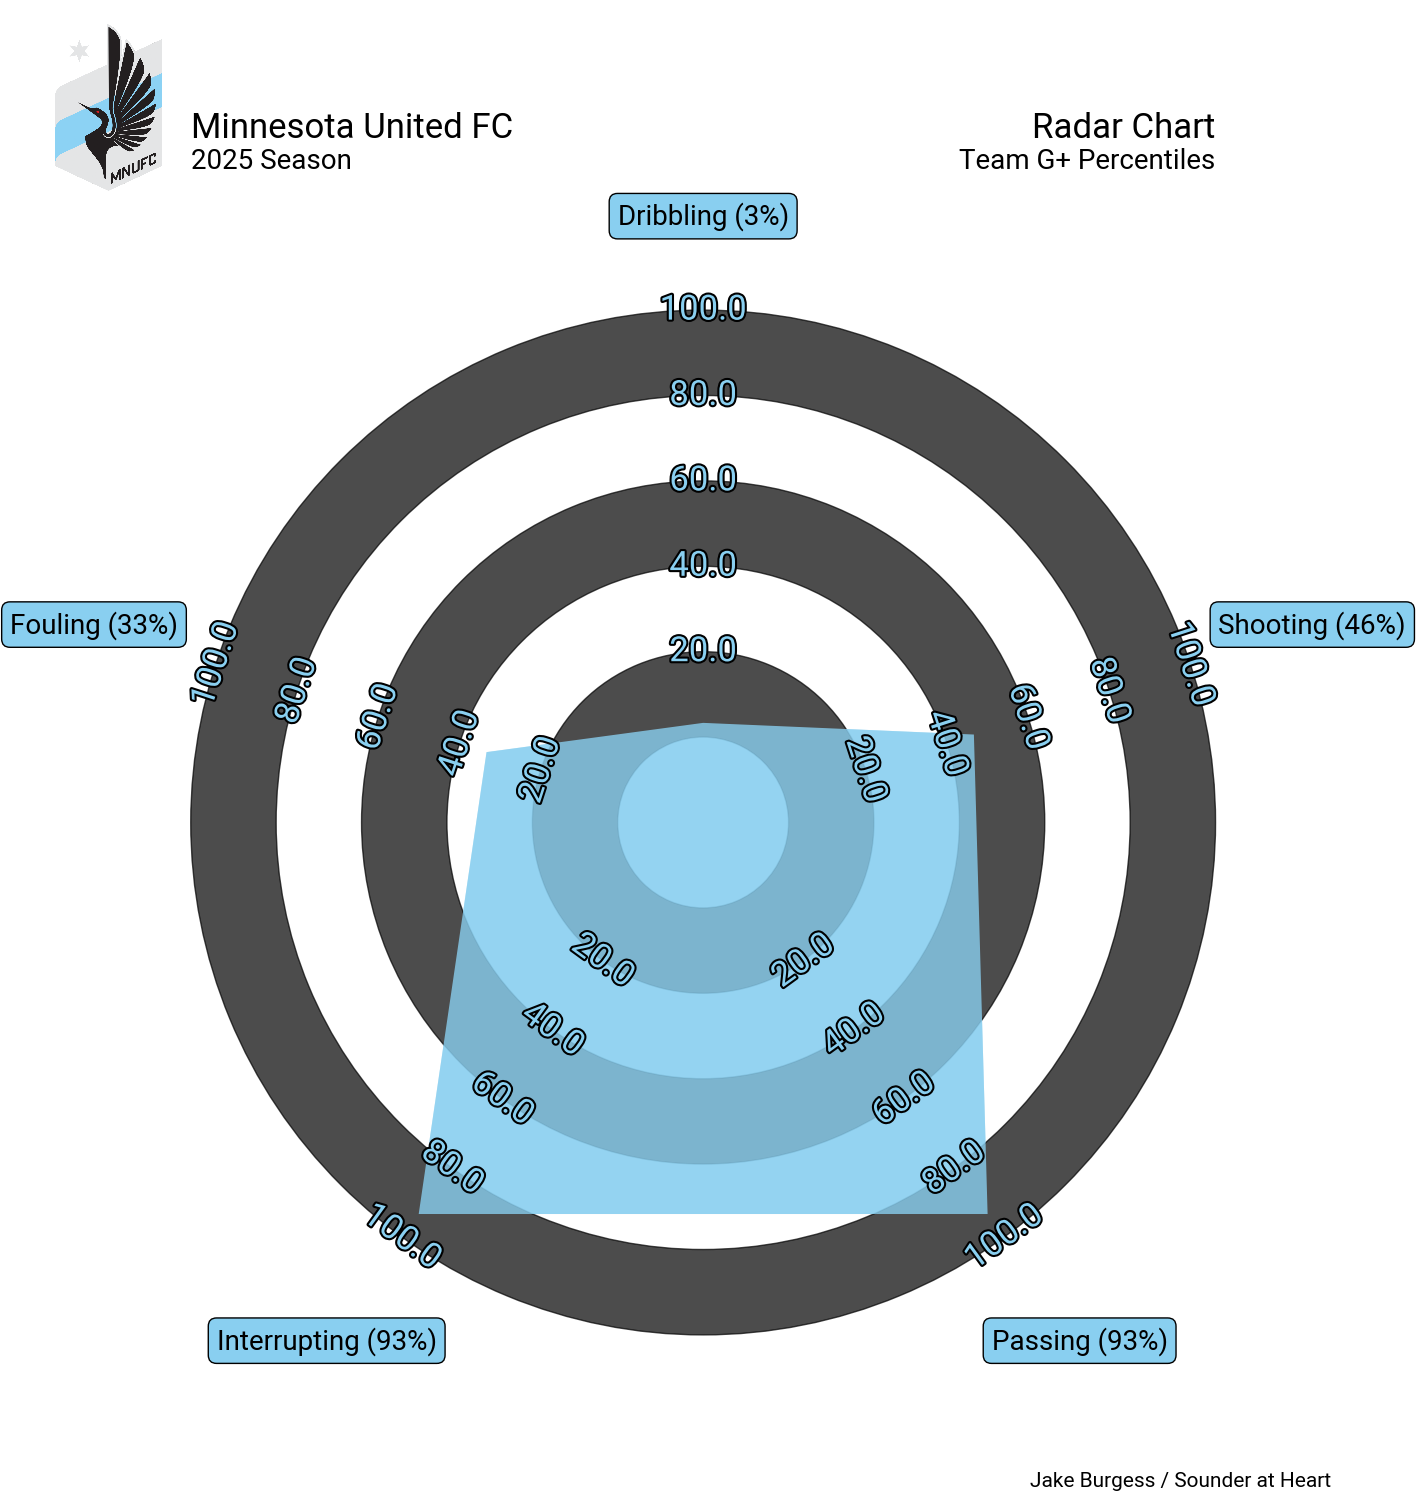
Throughout the 2025 season, the Sounders have been among the league's most effective sides in generating “shooting” G+* value (73rd percentile in MLS). They consistently create high-quality chances. Minnesota, by contrast, are below average in that category but strong in “interrupting play” (93rd percentile), which means preventing opponents' attacks from turning into big chances through defensive actions like tackles, interceptions, and blocks.
The stat that stood out to me most from these radar charts is Minnesota's ranking in the 93rd percentile in the league for "passing" goals added. Despite attempting relatively few passes compared to their opponents, the Loons are extremely efficient at generating value from the ones they do attempt. They excel at completing direct, counterattacking passes that quickly move the ball into dangerous areas, making each possession count even across a low volume of match events in any given attack.
The Numbers Behind the Attack
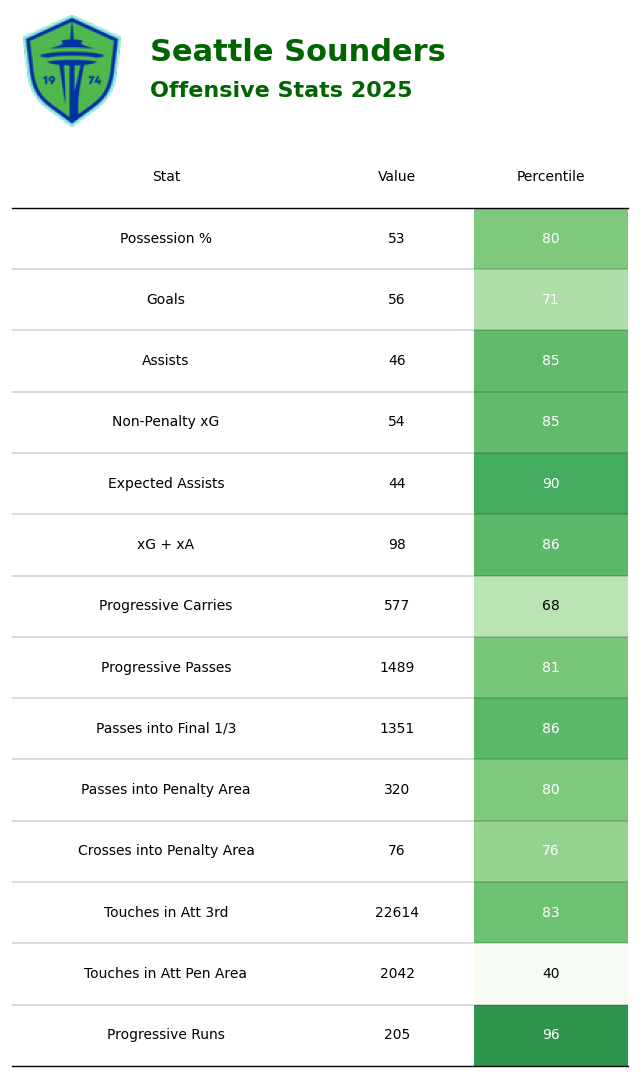
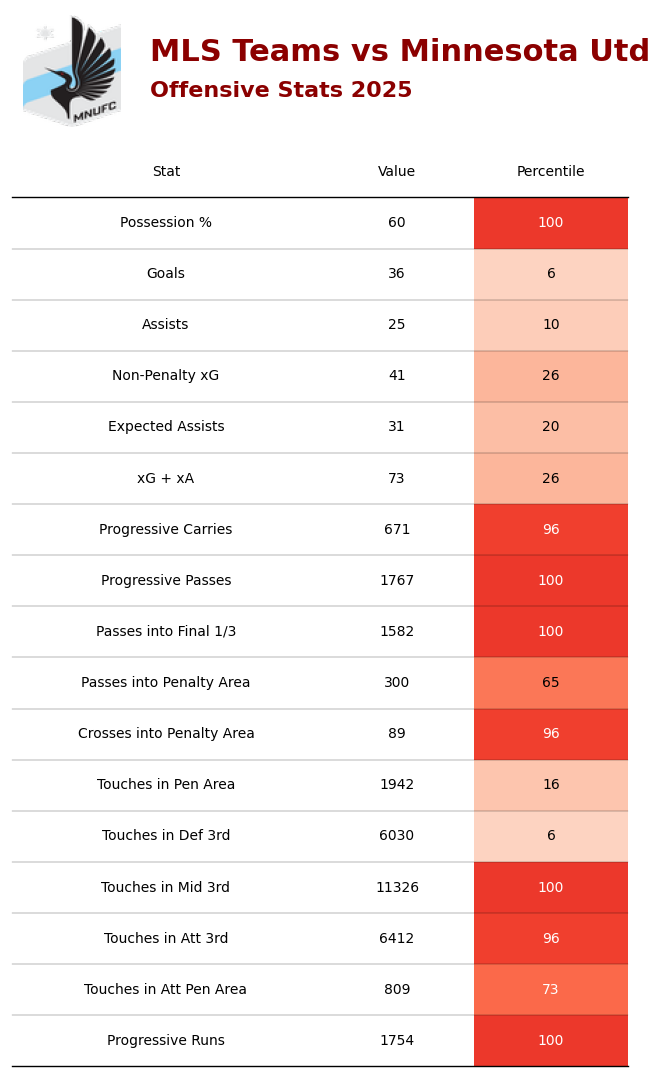
When it comes to creating danger, Seattle outpaces Minnesota in nearly every key attacking metric. The Sounders rank above the 85th percentile in expected goals, expected assists, passes into the final third, and progressive runs. They spend matches keeping defenses under constant pressure in dangerous areas.
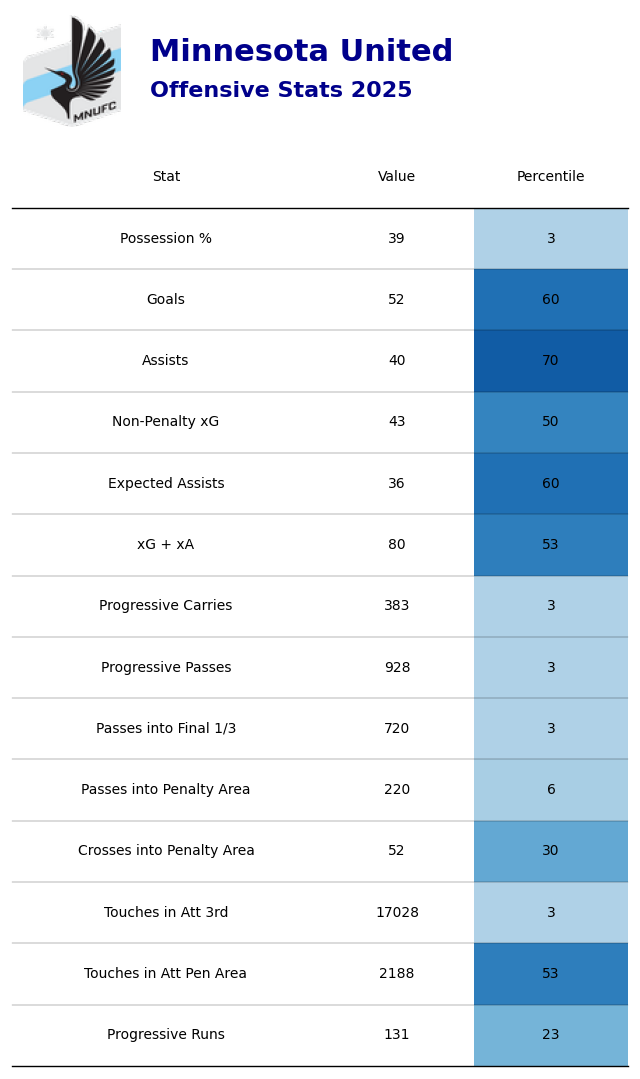
Minnesota does not stand out in any of the attacking metrics provided. The Loons fall as low as the 3rd percentile in possession, progressive carries, and progressive passes. Despite limited opportunities, Minnesota has been highly effective at converting counterattacks into opportunities as their goals and expected goals numbers are above average (60th percentile). This goes to show that the Loons can produce positive results even with minimal chances throughout a game. They have shown that they are capable of doing this against the Sounders in each of their previous three encounters.
Defensive Profiles
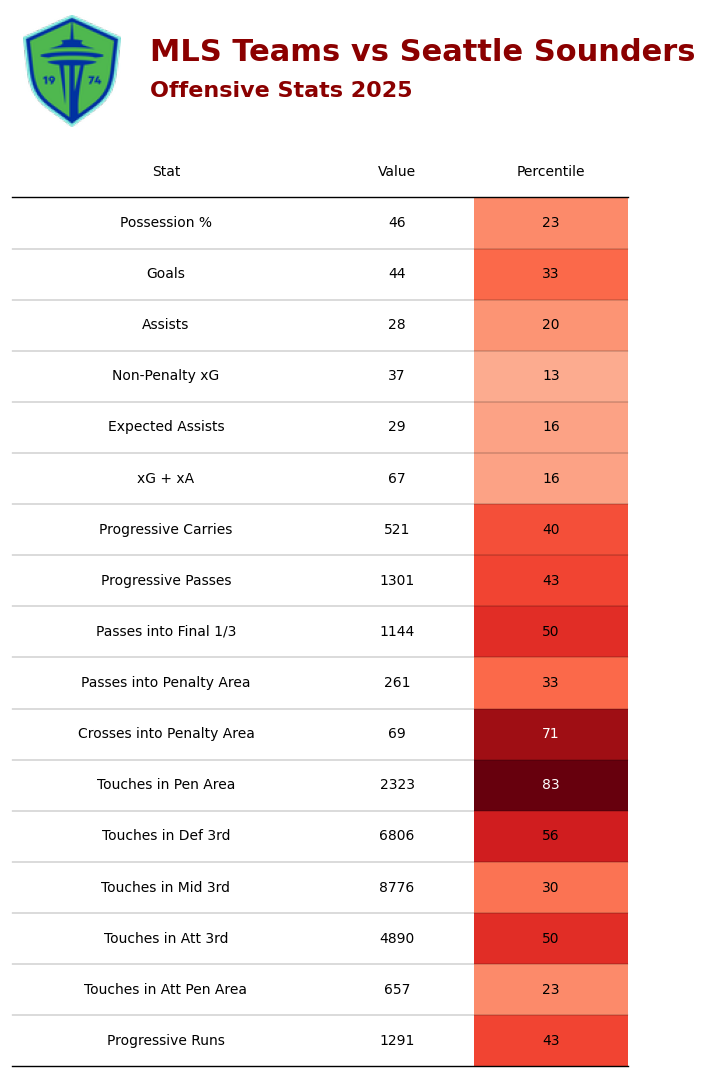
Seattle have been strong all season at limiting opponent possession and chance quality. Their success comes from how well they control the game with the ball. Their possession and attacking structure keep opponents pinned back and away from dangerous areas.
Minnesota sit at the opposite end of the spectrum in terms of on-ball metrics. They are one of the lowest possession teams in the league, often stuck deep and relying on transition play to get results. Despite this, they have done an impressive job at limiting dangerous chances for their opponents. While Minnesota allow practically the most touches, passes, and crosses in their own final third across all teams in the MLS, they concede just under the fewest goals and xG in the league.
Regular-Season Momentum and Recent Form
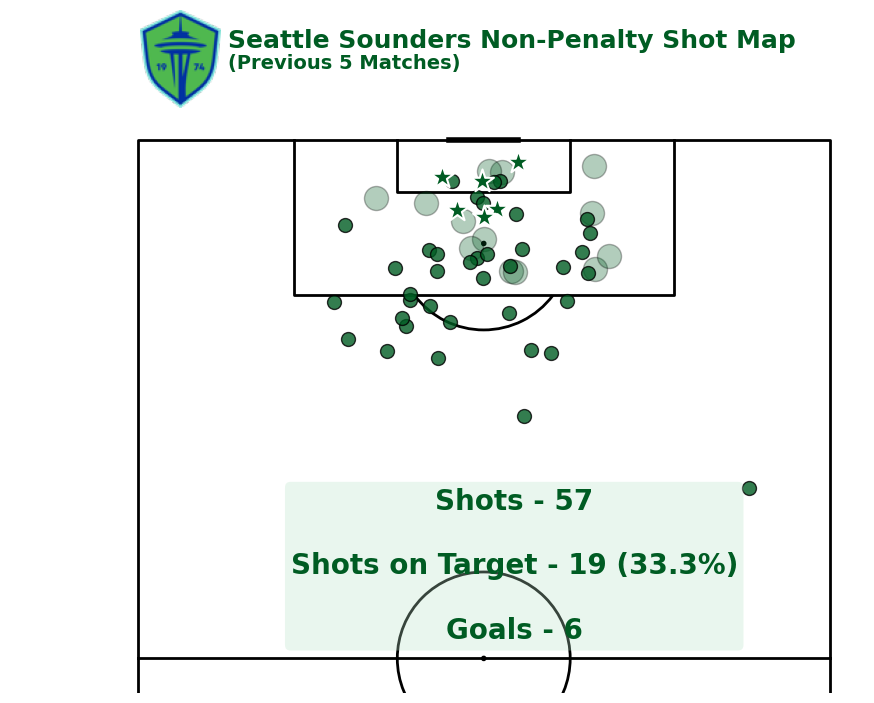
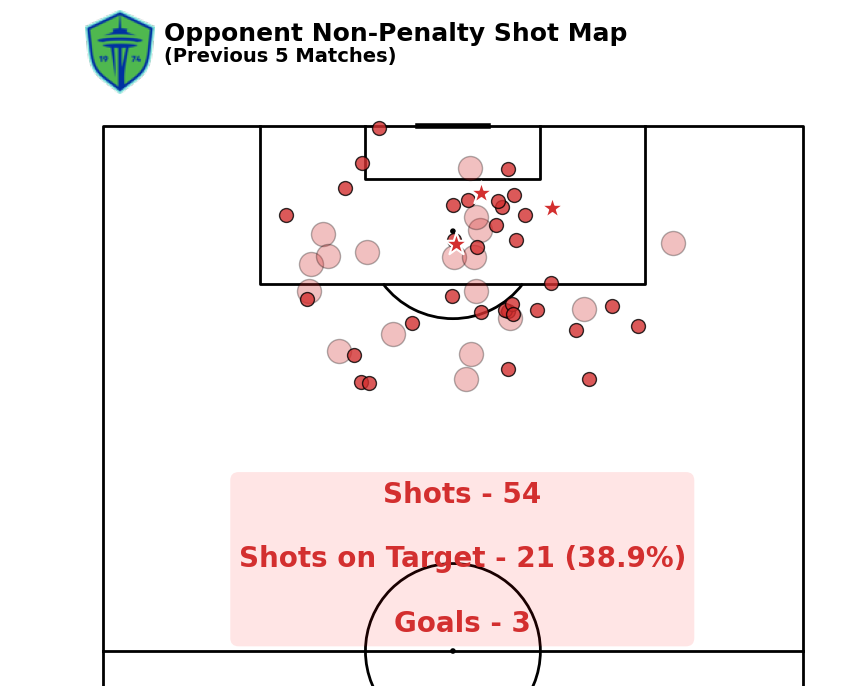
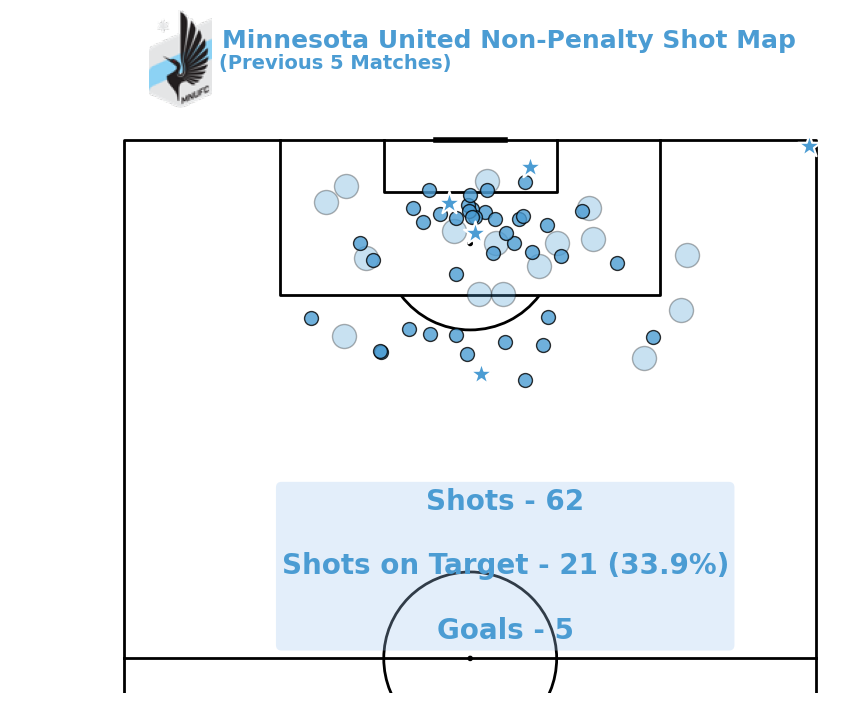
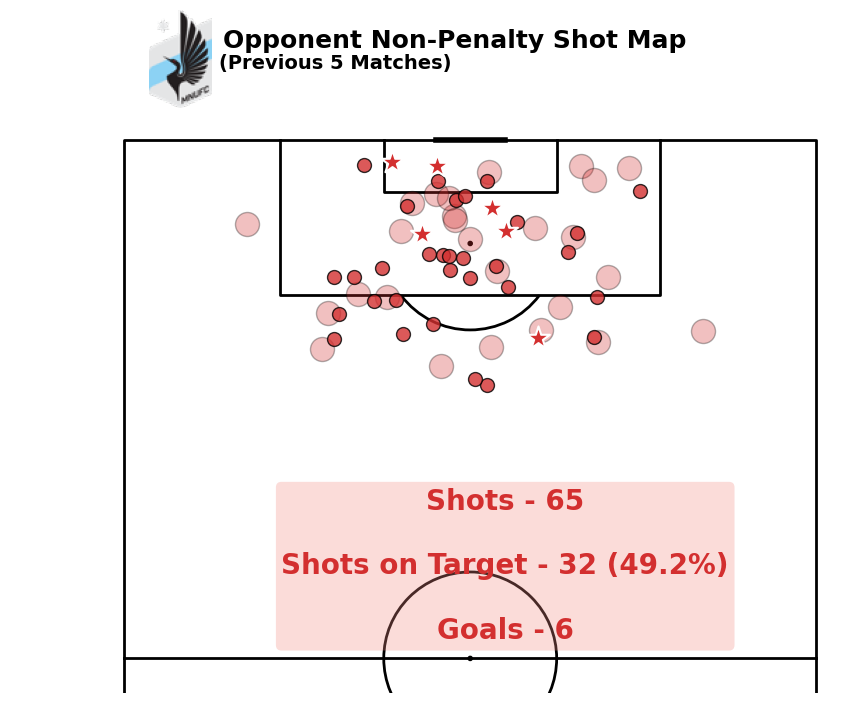
Over the past five games, Seattle and Minnesota have generated a similar number of shots and goals, with comparable conversion rates. However, opponents have put up 11 more shots against Minnesota, with a 10% higher on-target rate compared to teams facing Seattle. Seattle has a +3 goal difference over this stretch of matches compared to -1 for Minnesota.
Minnesota's overall form has fallen sharply since August, right around the time Tani Oluwaseyi departed for Villareal. Before his move, he tallied 10 goals and seven assists, and his absence has left a major void in the attack.
Seattle, in contrast, have maintained a consistently positive expected goals differential across most of the season, aside from a brief dip in June. This is especially impressive when you factor in the additional matches and success in the Leagues Cup this year.
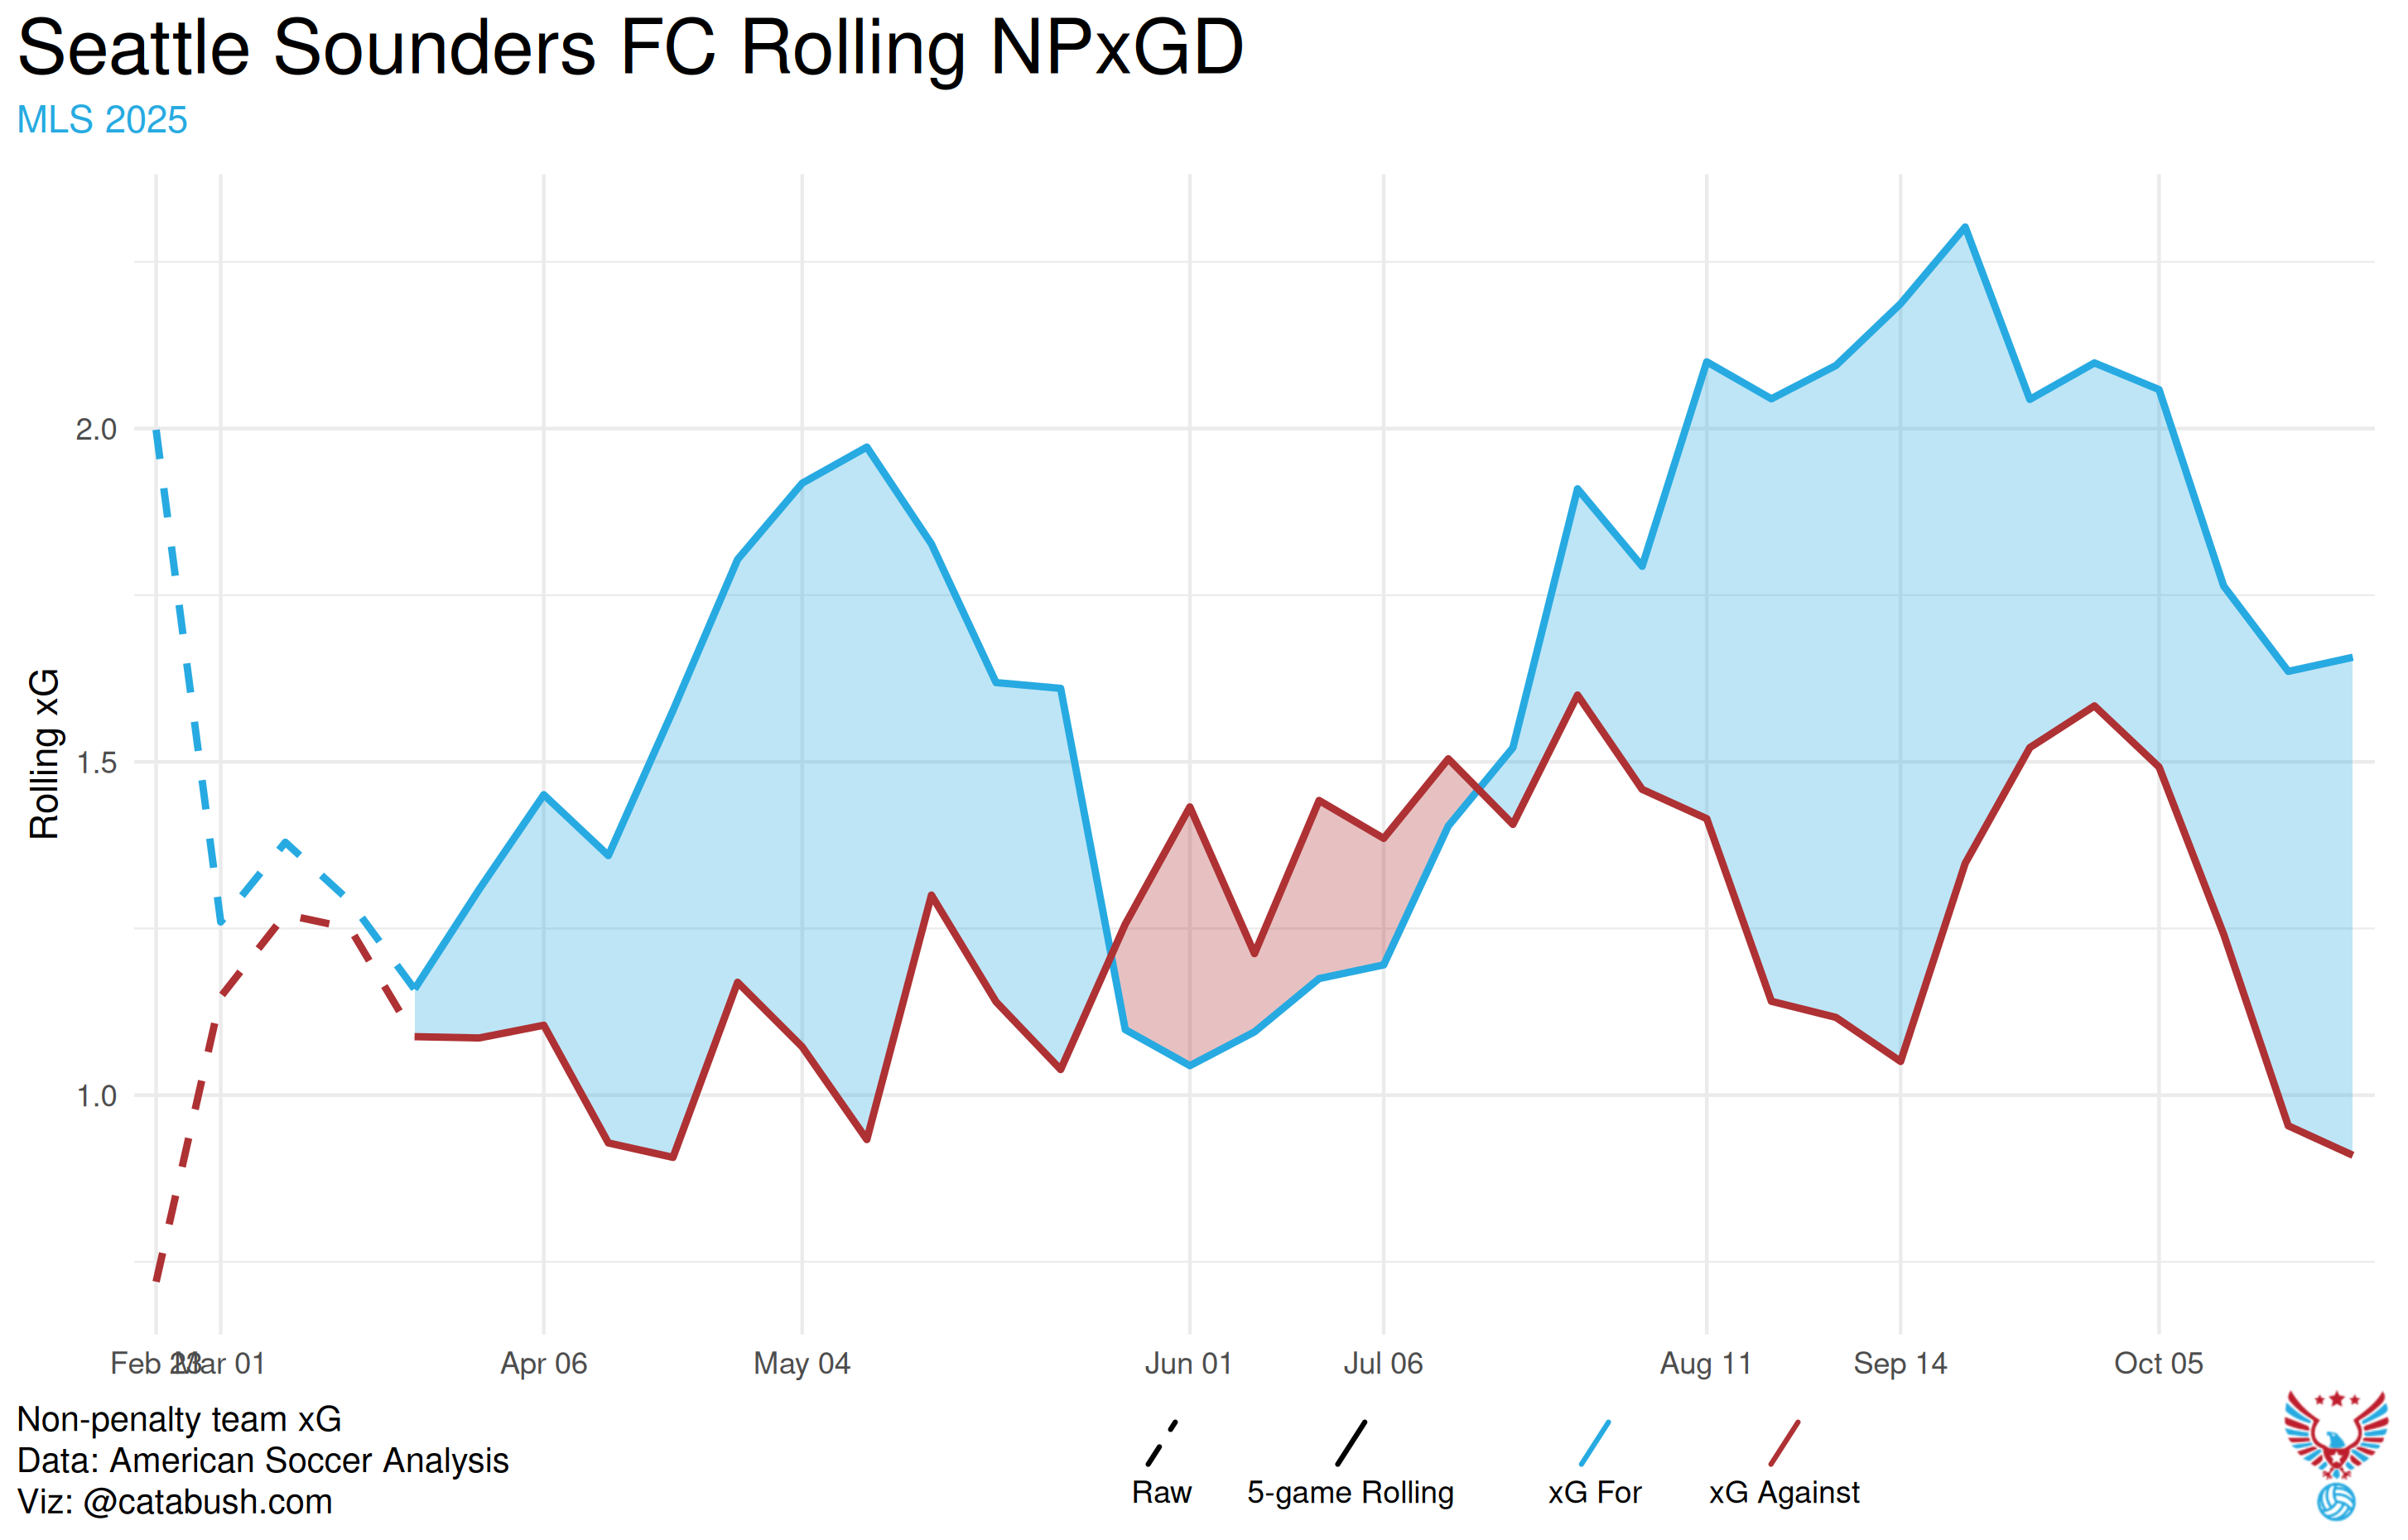
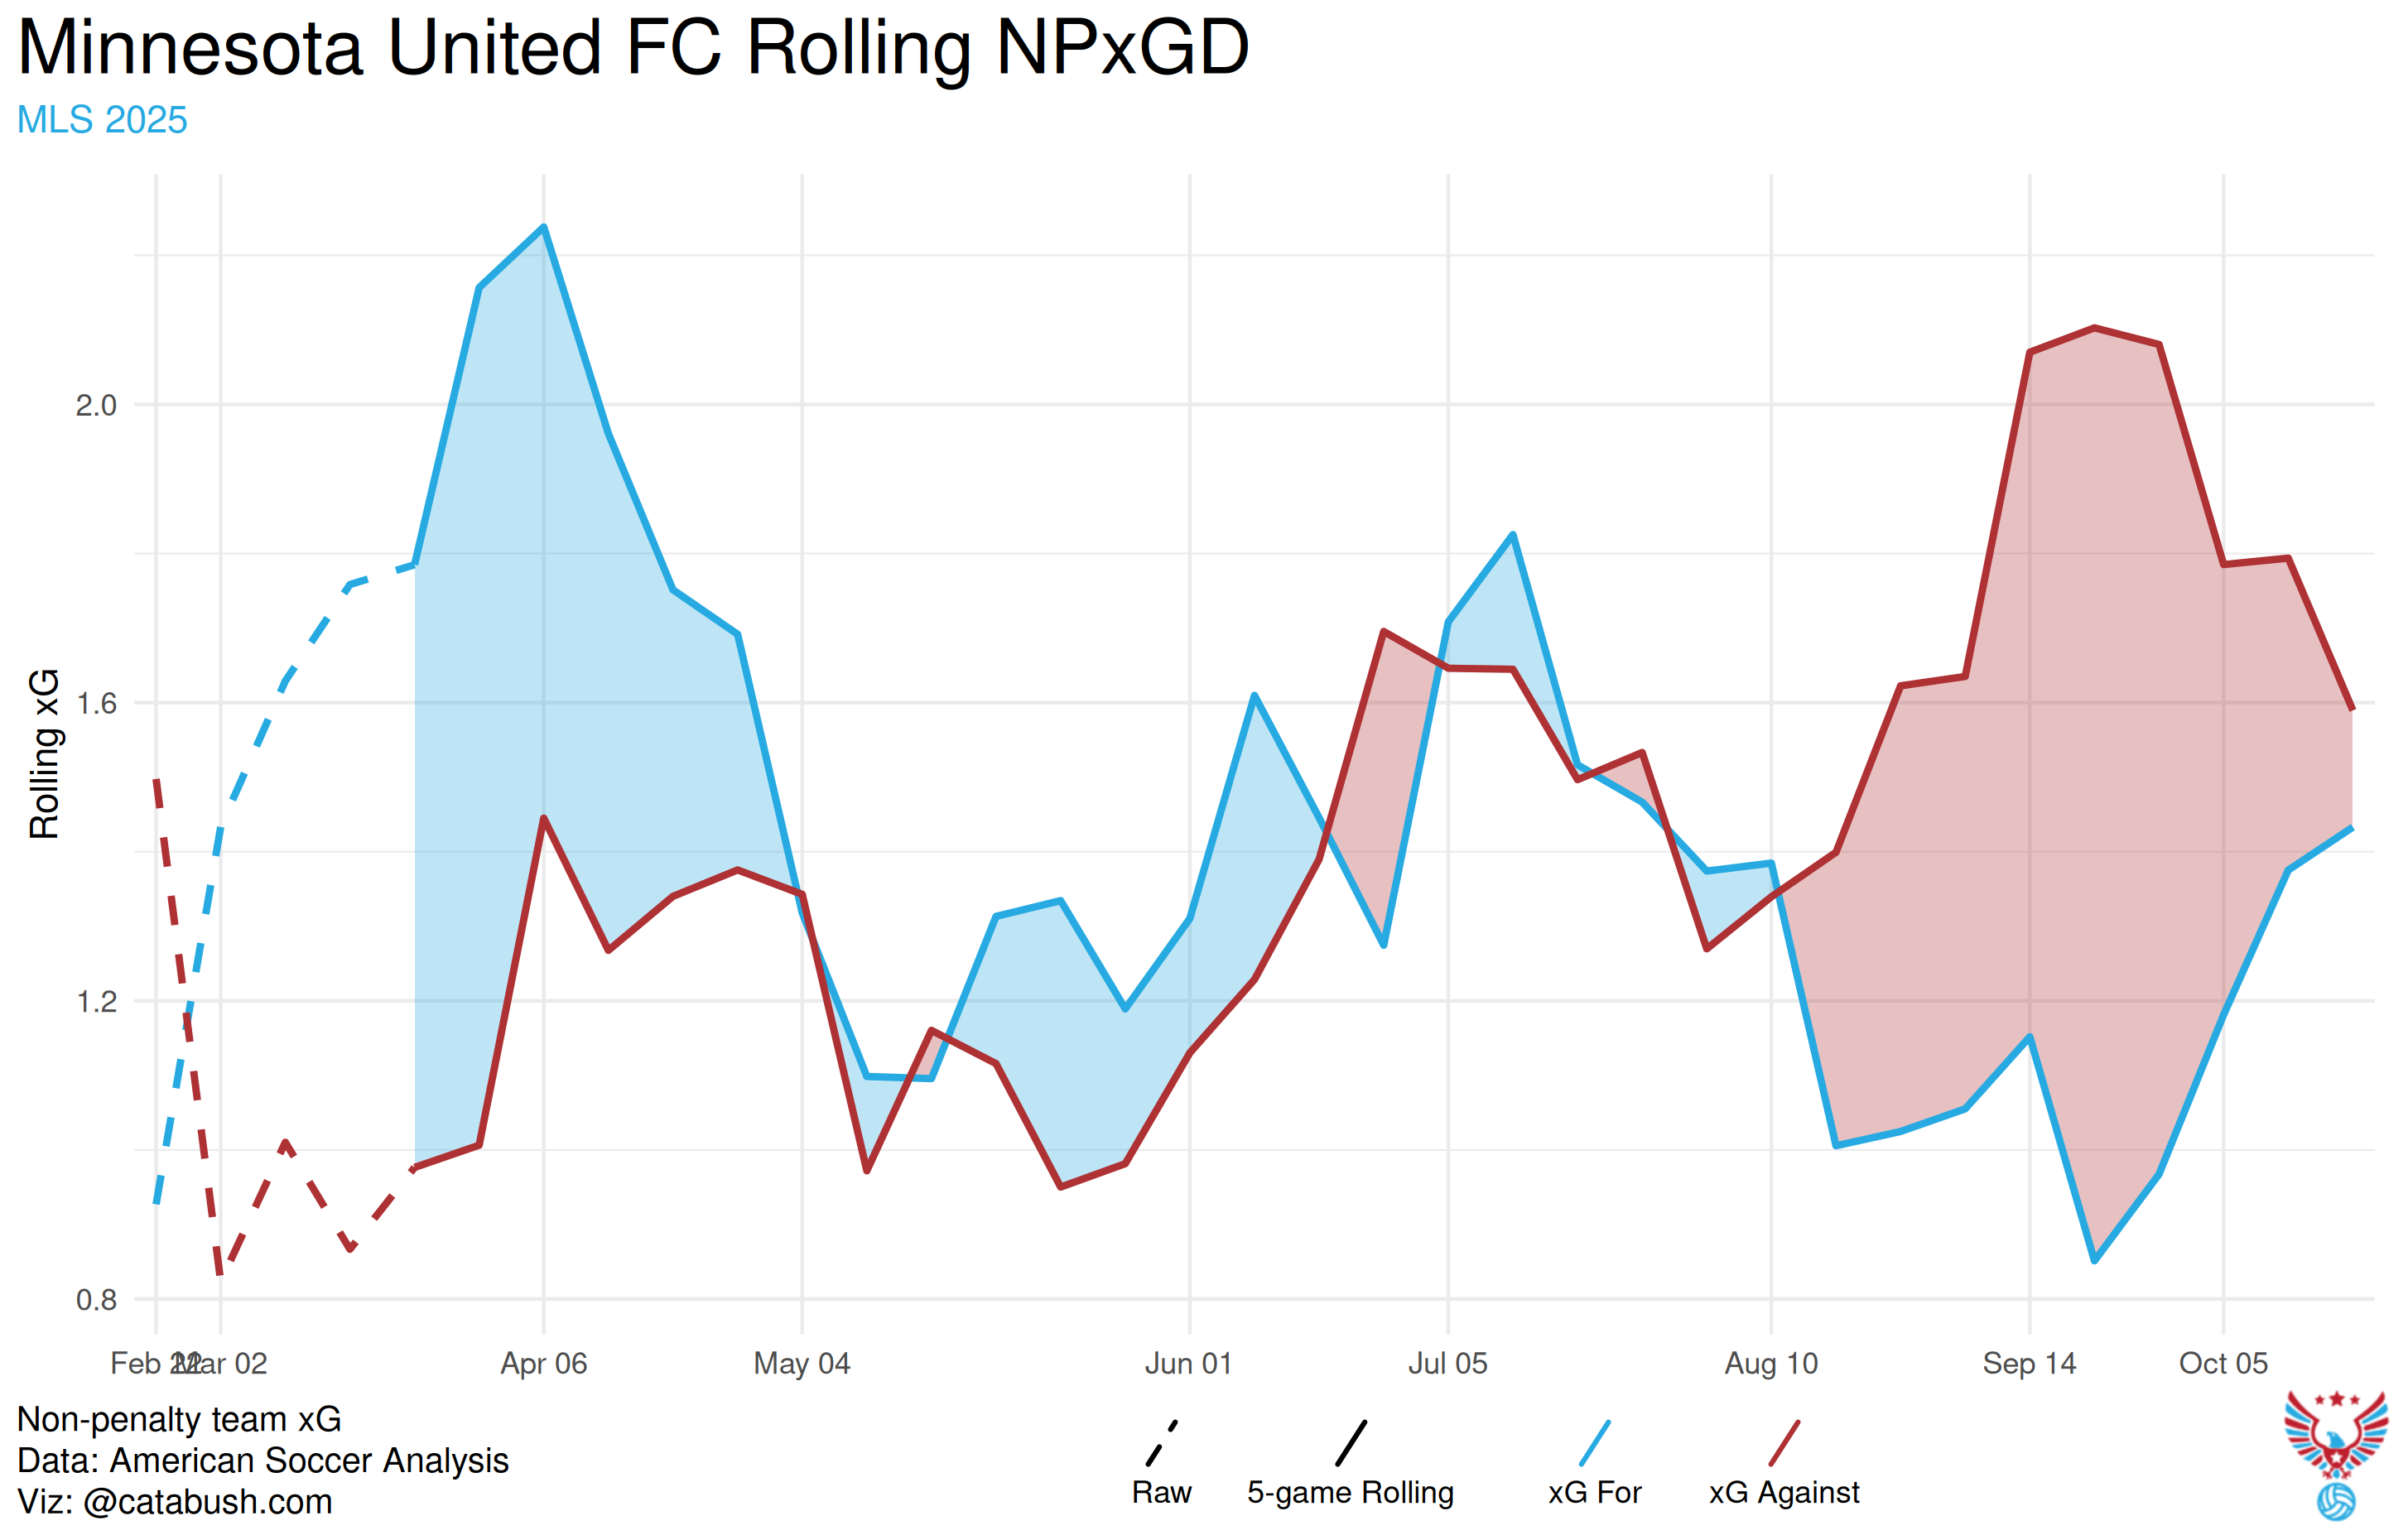
Source: ASA Viz Hub
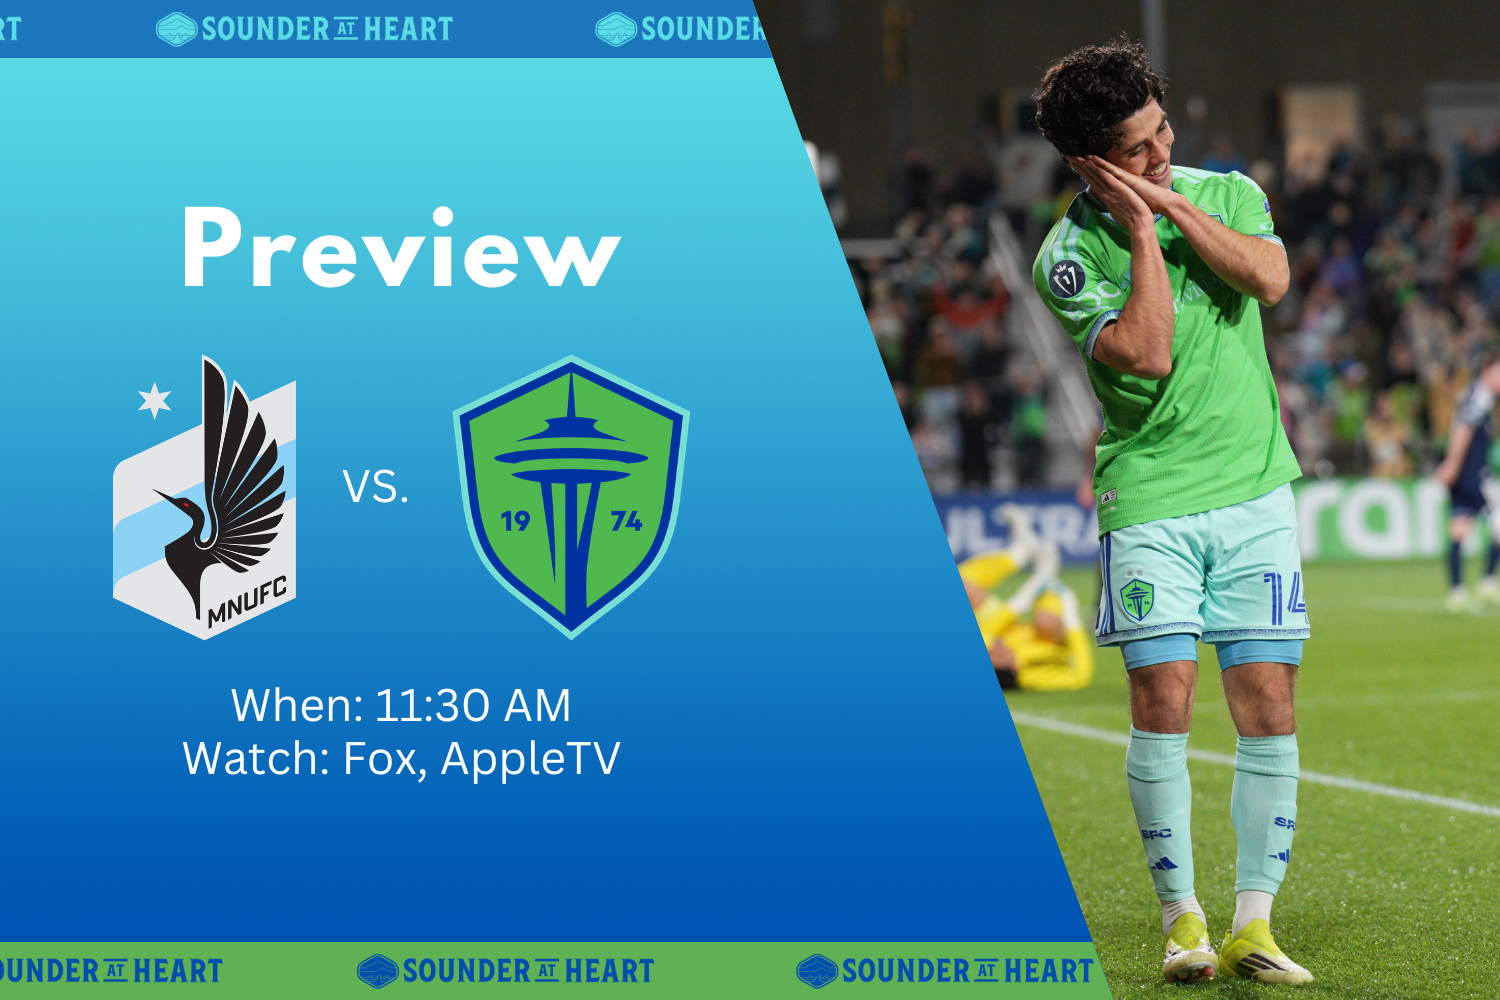
Outlook for Game 2
On paper and in performance, the Sounders are overdue. Despite being winless in three meetings with Minnesota this year, the metrics suggest Seattle have been the better side. If they replicate the control and creativity from Game 1 and finish their chances, the Sounders should have what it takes to win at home and force a decisive third game.
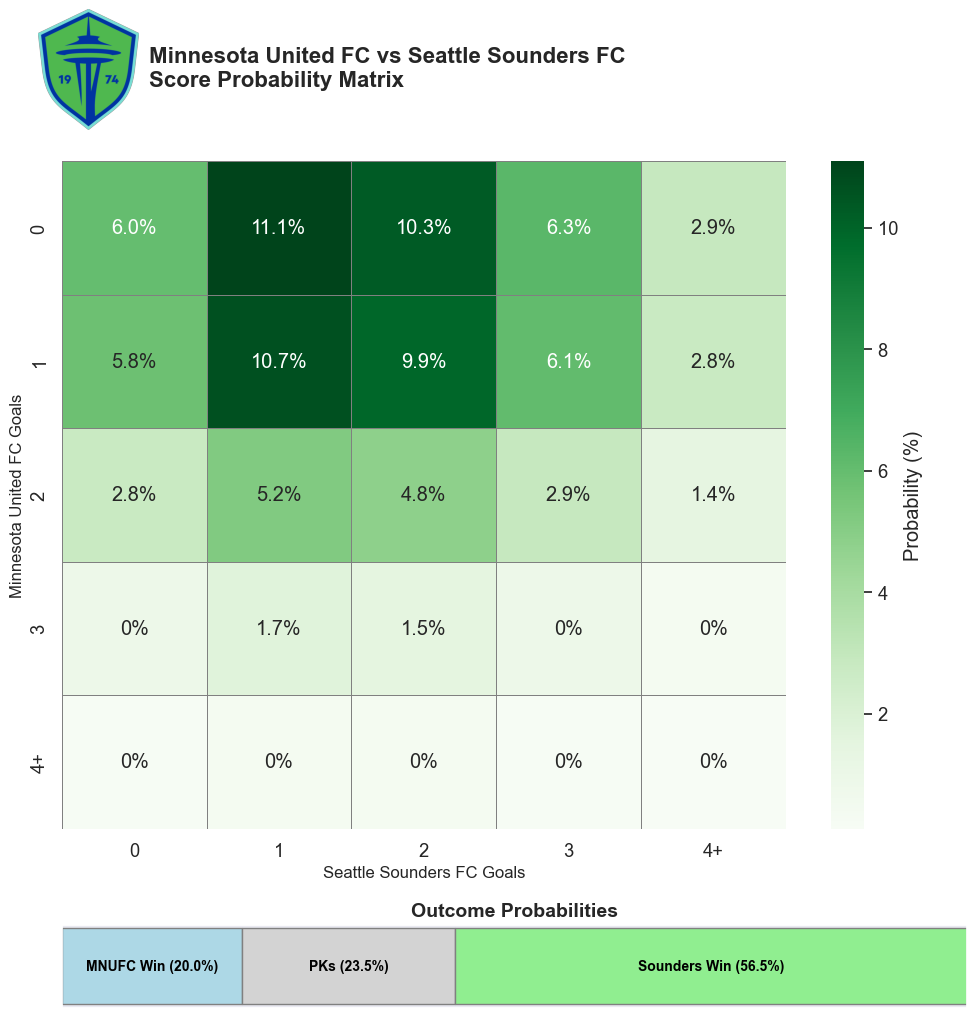
According to our match prediction model, which uses expected goals for and against these teams in all matches this season, Seattle holds a 56% chance of winning Game 2. Based on the numbers and how the performances have trended, that feels about right.
G+ : Goals added is a metric created by American Soccer Analysis that quantifies a player's impact by measuring how much their actions change their team's probability of scoring and conceding a goal. Goals added are split into individual categories including dribbling, fouling, shooting, receiving, passing, and interrupting which all contribute to an overall G+ score.
Attacking Momentum: Composite score based off of various attacking metrics, like ball possession, shots, goals, big, chances derived from SofaScore.