Game 2 Overview
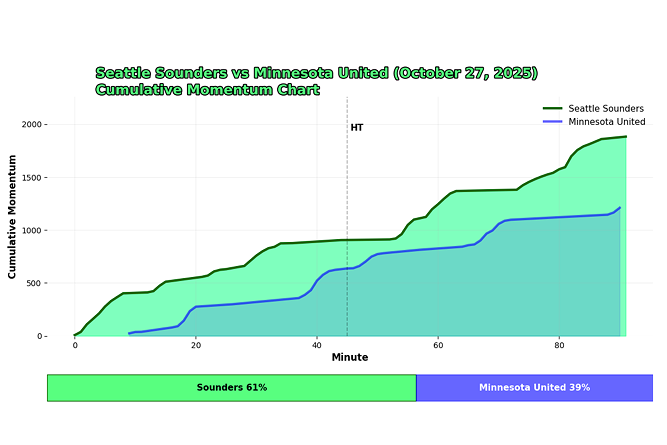
From the opening whistle in Game 2, it was clear that the Sounders had one objective: to score goals. Every run, every pass, and every press carried the mark of a team determined to break down Minnesota United and put chances away. That mentality, combined with positional adjustments, allowed the Sounders to dominate.
Heading into Game 3, the challenge will be translating that same motivation and intent onto the pitch in Minnesota. If Seattle, can replicate the hunger, focus, and attacking cohesion displayed in Game 2, the outcome should favor the Sounders once again.
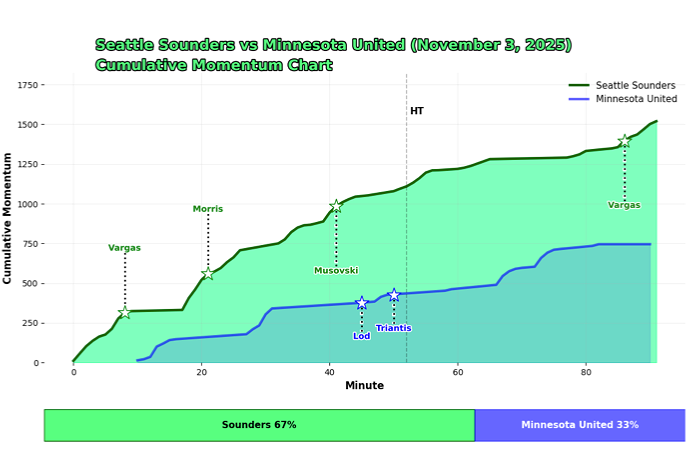
The Sounders have clearly outperformed the Loons in attacking momentum through the first two games of the series, and I don't expect that to change in Game 3. Minnesota’s chances and goals have largely come from Seattle’s own mistakes, giving the ball away in dangerous areas. To secure a win in Game 3, the Sounders will need to protect the ball better, as giveaways by Jordan Morris and Yeimar Gomez Andrade in silly areas nearly handed the game back to Minnesota after Seattle had build a three-goal lead. Minnesota’s counterattack — more than set-pieces, at least so far — is their biggest weapon, and careless turnovers through the middle are a recipe for trouble as we began to see in Game 2.
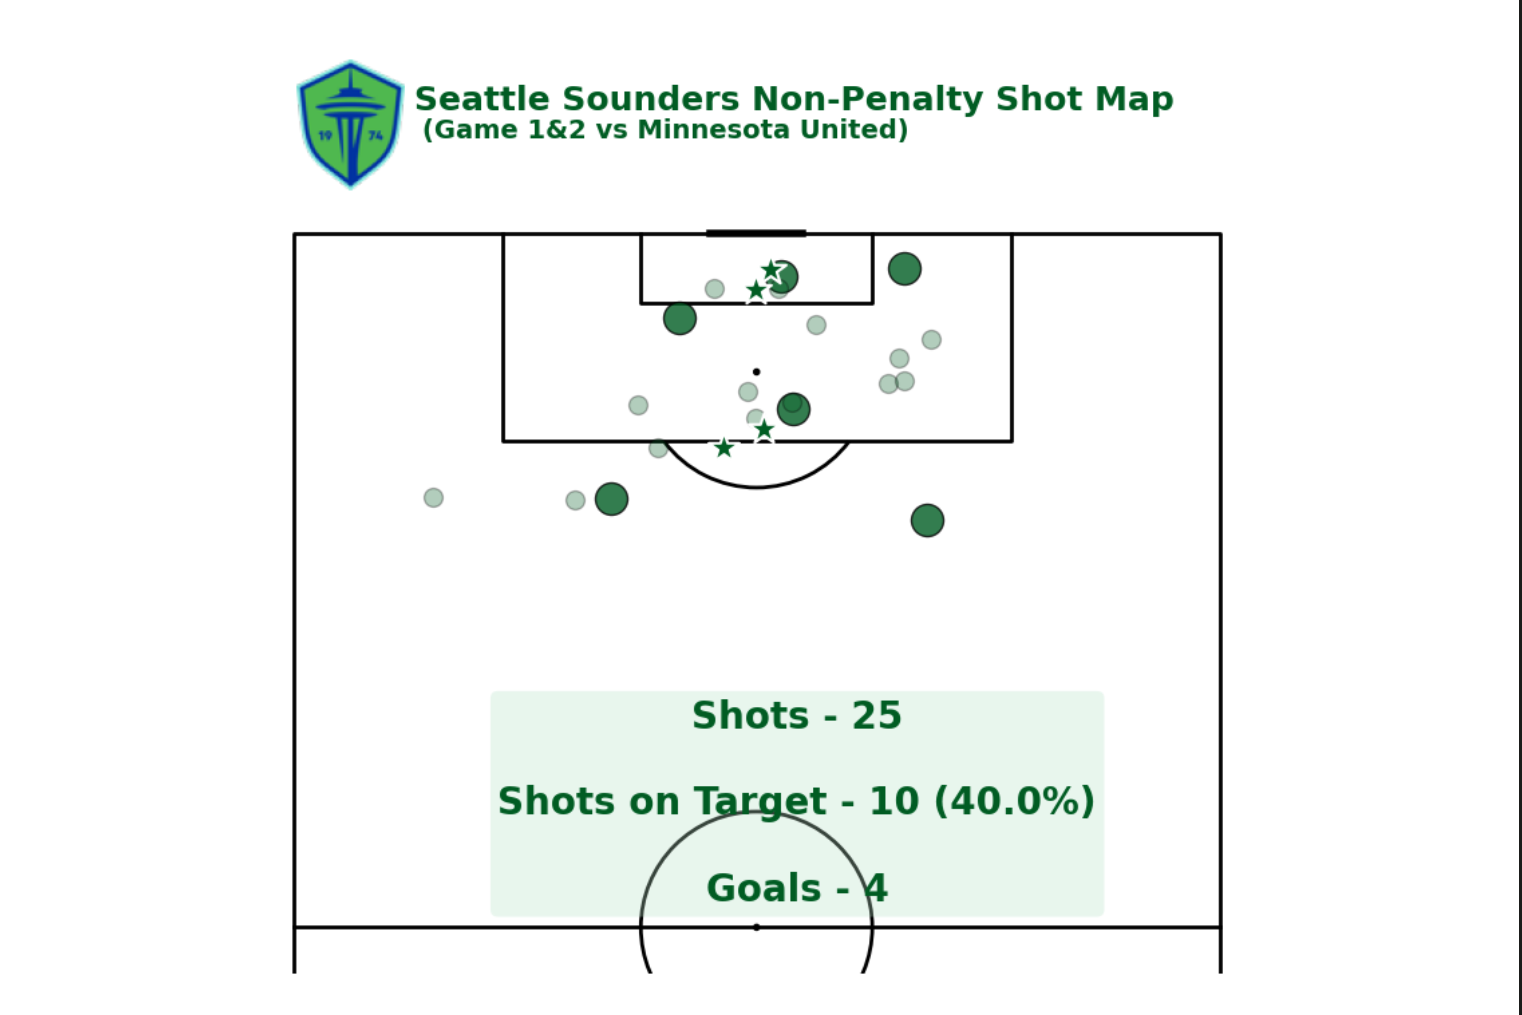
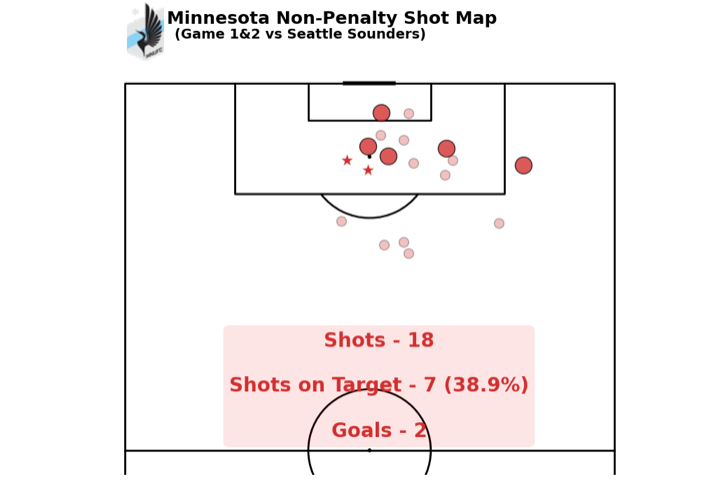
Through the first two games of the series, Seattle has taken the upper hand in offensive production, leading Minnesota 25 shots to 18. Both teams have converted roughly the same proportion of attempts into shots on target (40%). As we learned in Game 1, generating more shots doesn’t automatically translate into goals. To win Game 3, the Sounders need to pair shot volume with a hunger for goals as every chance matters, and finishing the opportunities we create will be key.
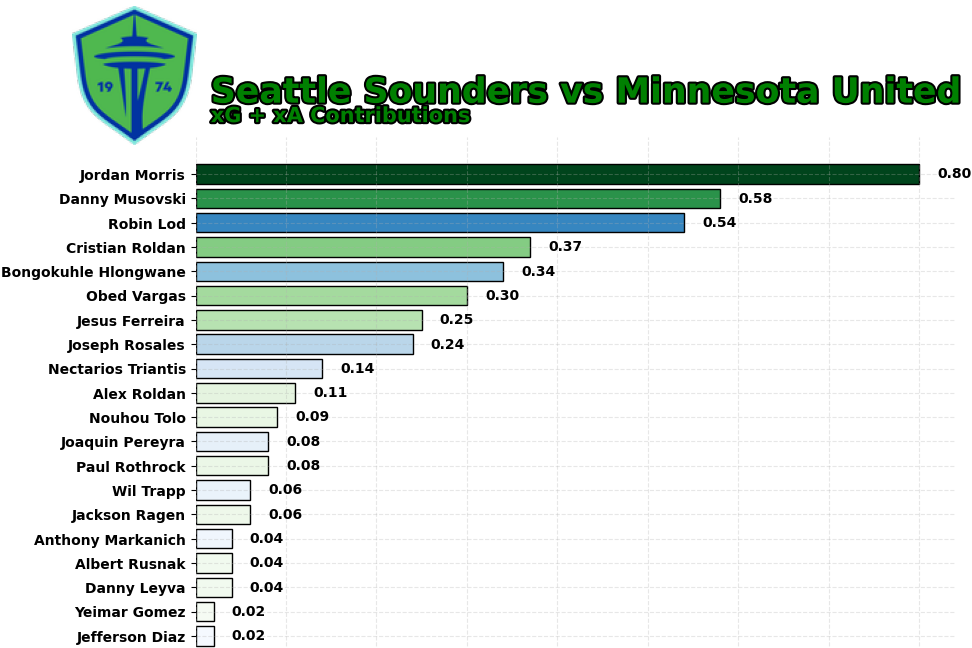
Morris and Danny Musovski once again stood out in Game 2, driving xG and xA creation. What’s interesting is that despite how dominant Seattle looked in Game 2, both Morris and Musovski actually posted higher combined xG + xA numbers in Game 1, despite Moose coming into the game off of the bench. Morris finished that first match at 1.6 xG + xA, while Musovski registered 1.3. So while Game 2 felt like a statement performance, which it was, the numbers show we were just as effective at breaking Minnesota down in Game 1 and we just didn't finish our chances. The ability to create quality looks in both matches is an encouraging sign heading into Game 3. Credit to Brian Schmetzer, who recognized the uptick in attacking production late in Game 1 after subbing on Musovski and shifting Morris as he carried this strategy into Game 2 and it continued to work.
Game 1 & 2 Aggregate Performance Comparison
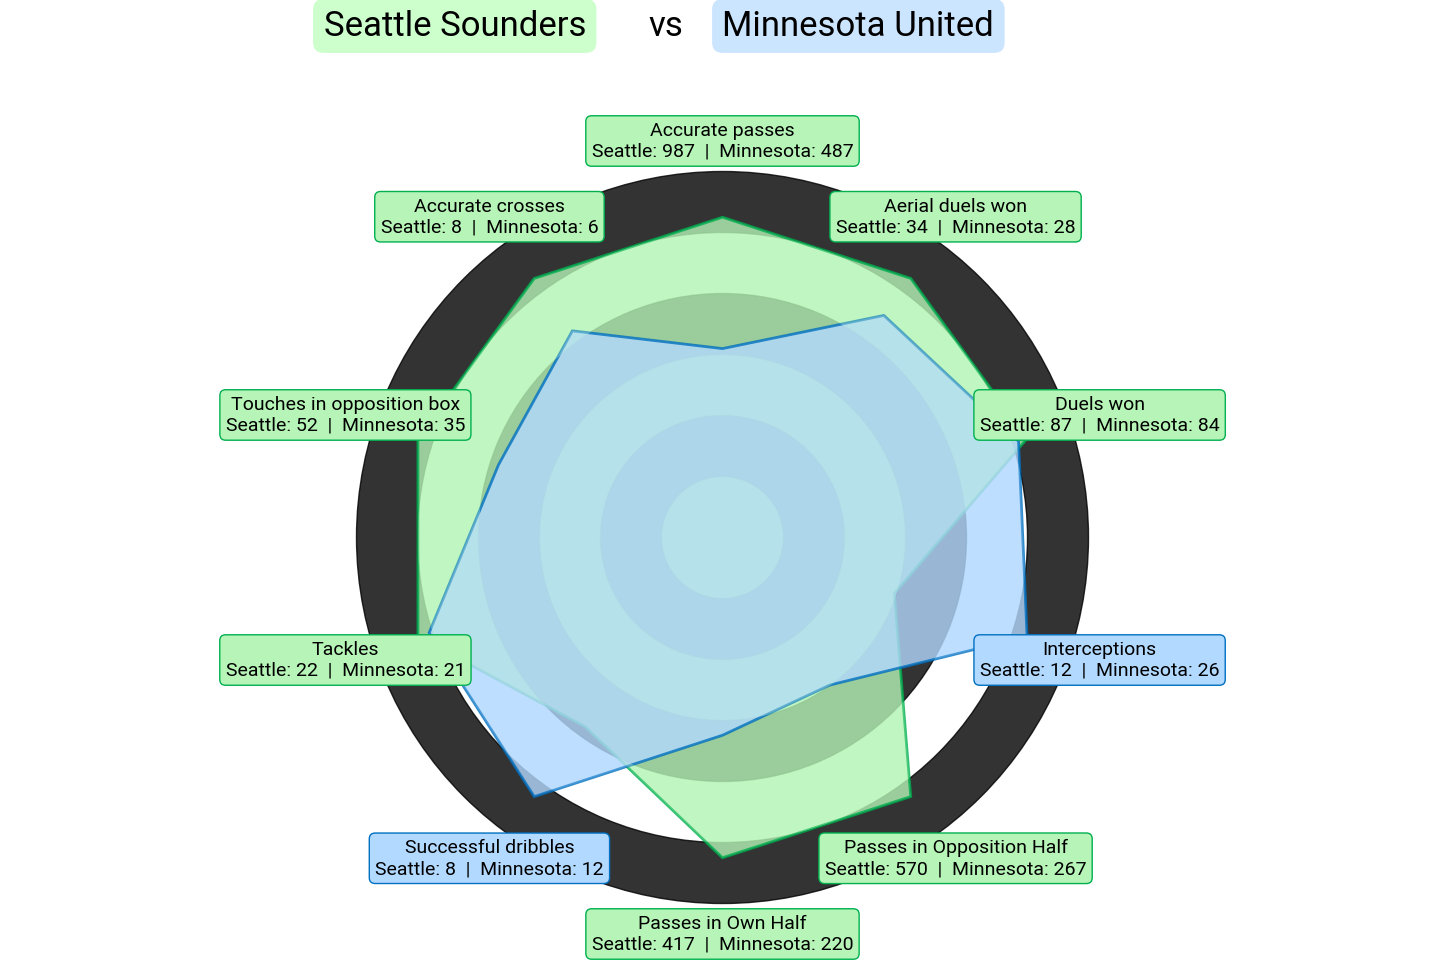
Across both matches, Seattle outperformed Minnesota in nearly every offensive metric. Even though Minnesota held a slight edge in total successful dribbles, it’s clear the Sounders are far more dangerous against a deep-lying, counter-attacking team.