It’s difficult to describe the scale of the Seattle Sounders’ current injury crisis.
With Paul Rothrock’s most recent injury – estimated to keep him out 8–10 weeks — the Sounders will see the vast majority of their regular outfield starters miss extended minutes in 2026. The only real exceptions to the rule at the moment are Nouhou, Albert Rusnak, Kalani Kossa-Rienzi and Snyder Brunnell.
A team that hasn’t been allowed any level of consistency, and is yet to see all three of its DPs share the field at any point all season, has predictably struggled to pick up points.
Brian Schmetzer has been given the nearly impossible task of assembling winning squads with a roster that is being held together by Scotch tape and Elmer's glue. Even the gaffer sounded in utter disbelief announcing Rothrock’s injury, starting his statement to the press with a beleaguered: “You guys aren’t going to believe this; it’s another injury.”
That is the point this crisis has led us to. Just when we don’t think the situation can’t become any more dire, a new leak is sprung.
Schmetzer ended his address with an ominous statement: “Either we are getting really really really unlucky, or we are doing something really, really, really wrong.”
While the answer to that question remains elusive, I at least wanted a better way to illustrate to true depth of the problem. My solution is a new statistic I’m calling "Top-End Roster Stability," or TERS for short.
Before I get into the nuts and bolts of TERS, I will spoil the ending for you. The Sounders' recent injury woes are a statistical anomaly in both their own history and within MLS as a whole, and it’s hard to imagine that it can simply be chalked up to a bad run of fortune.
TERS/TERS+ Explanation
TERS is an admittedly imperfect and flawed statistic (cut me some slack with this, I haven’t taken a stats class since my first quarter of college). The intent of TERS is to measure the average availability/health of a team's most-used outfield players throughout a season. It does not specifically account for injuries and can also be affected by a team that simply has a lot of squad rotation. Regardless, it gives a rough estimate of how much a team is able to rely on getting their most trusted players on the field.
TERS is the combined average Minutes per appearance of a team's top five outfield players by total minutes played. For example, this is how I calculated the Sounders record-low 2026 TERS:
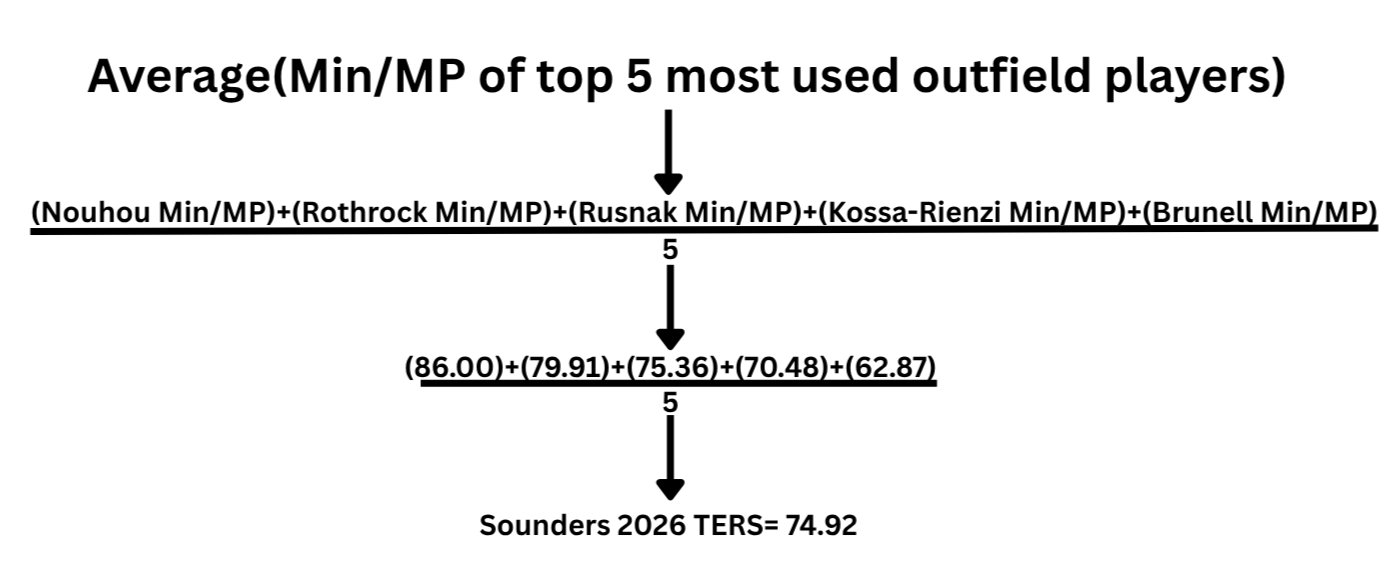
Of Schmetzer's favorite five outfield selections of 2026 — which include two outside defenders, two midfielders and one attacker — they collectively have averaged 74.92 minutes per appearance. That figure itself doesn't seem low, but when you compare it to the rest of MLS and the other 17 seasons in Seattle’s MLS history, it is nearly unheard of.
To illustrate the nature of this discrepancy, I’ve taken a page from baseball statistics and created TERS+, a version of TERS that draws on standard deviation and sample averages, putting it in a range of 0-200 where 100 represents an average TERS season.
To avoid getting too into the statistical weeds, this is a broad view of how to get from TERS to TERS+. You don’t have to get anything from this equation, but I am obliged to always show my work.
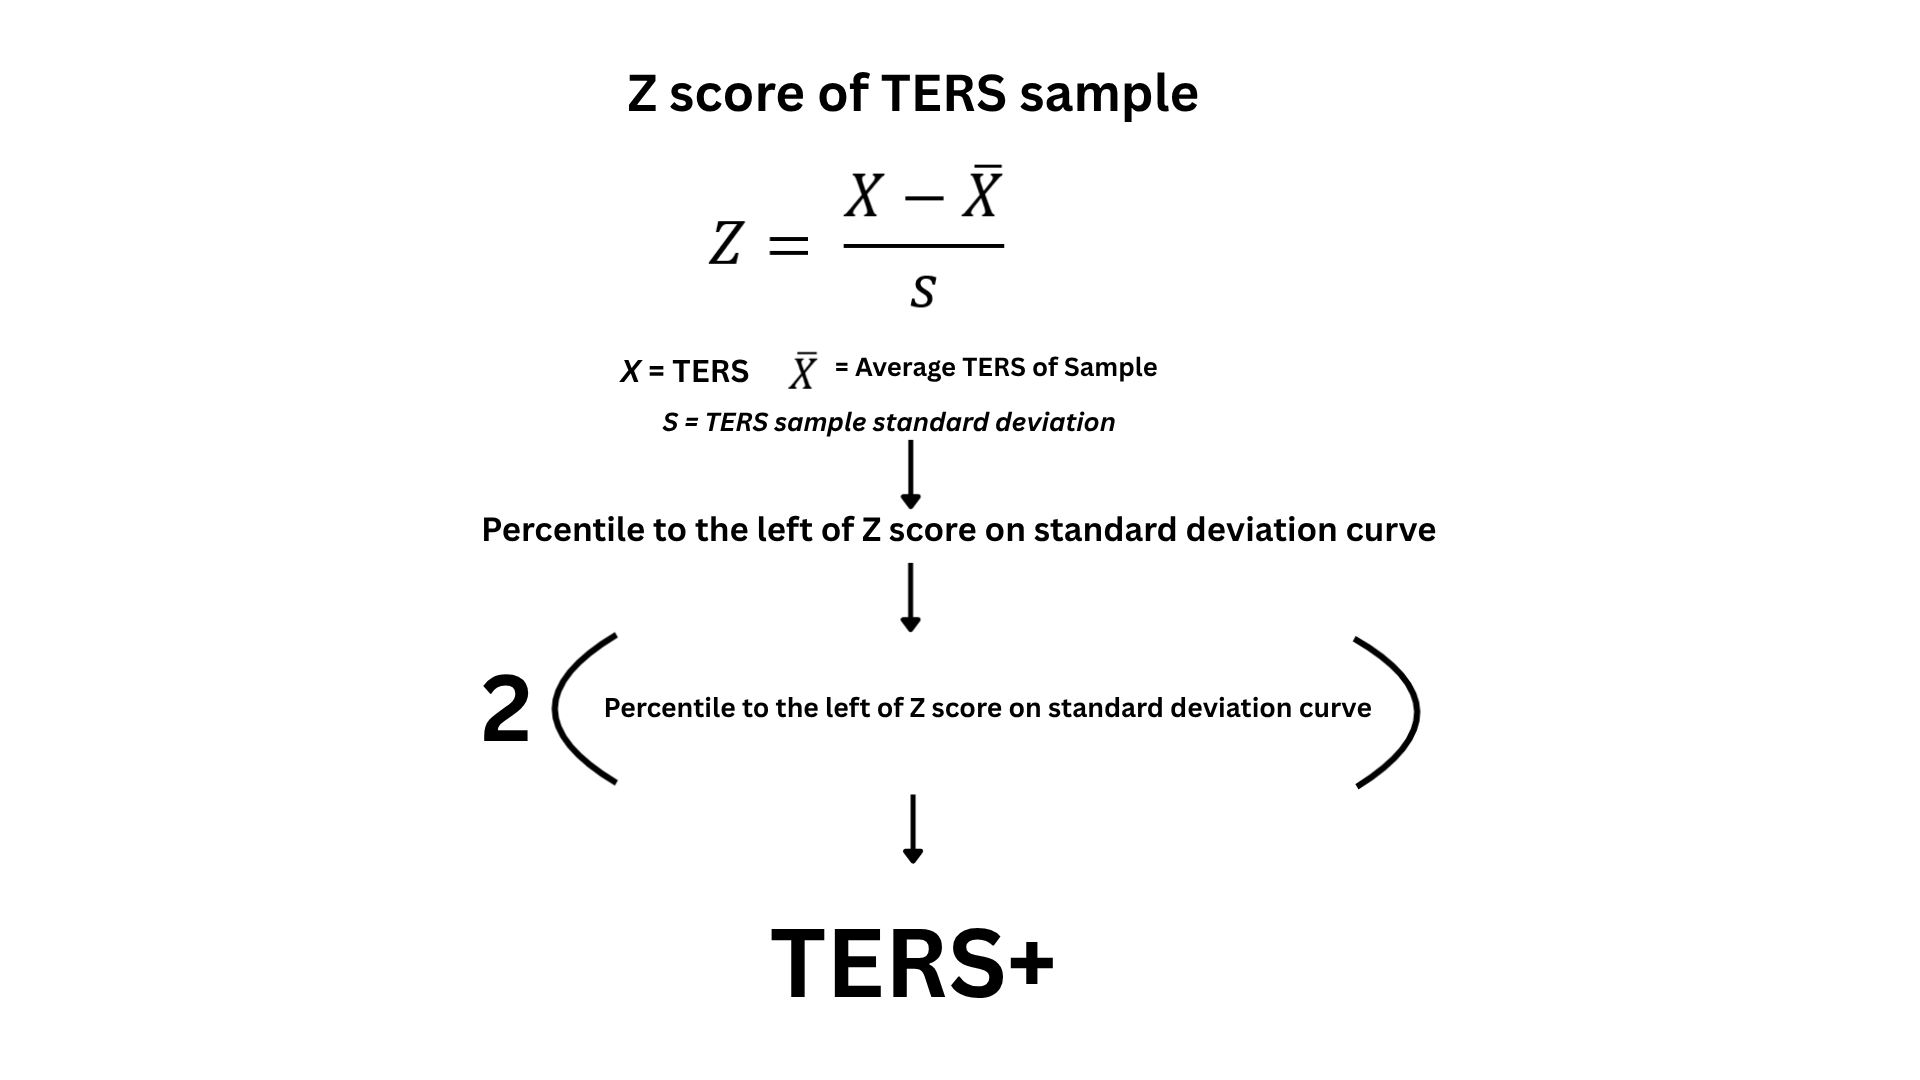
Essentially, it takes the TERS figure and makes it into a percentile, where 1% is an extremely low TERS and 99% is extremely high, and then switches it to a 0-200 scale. 1 is extremely low, 199 is extremely high, and 100 is the exact average of the sample.
You may notice that I then multiply the percentile by two. Is this pointless? Somewhat, but I believe putting the figure on a 0-200 scale with 100 as the average gives a more in-depth scale, better represents positive and negative figures, and resembles many of my favorite baseball statistics, which have been able to make extremely complicated figures in an extremely complicated sport much easier to grasp.
If you prefer to view this figure as a percentile, this will be included in all of my tables.
Seattle’s 2026 in TERS
It doesn't take a statistician to know Seattle has been one of the most rotated and injury-riddled teams in MLS this season, but when you look at the Sounders' average roster consistency as told by TERS, they are nearly alone at the bottom.
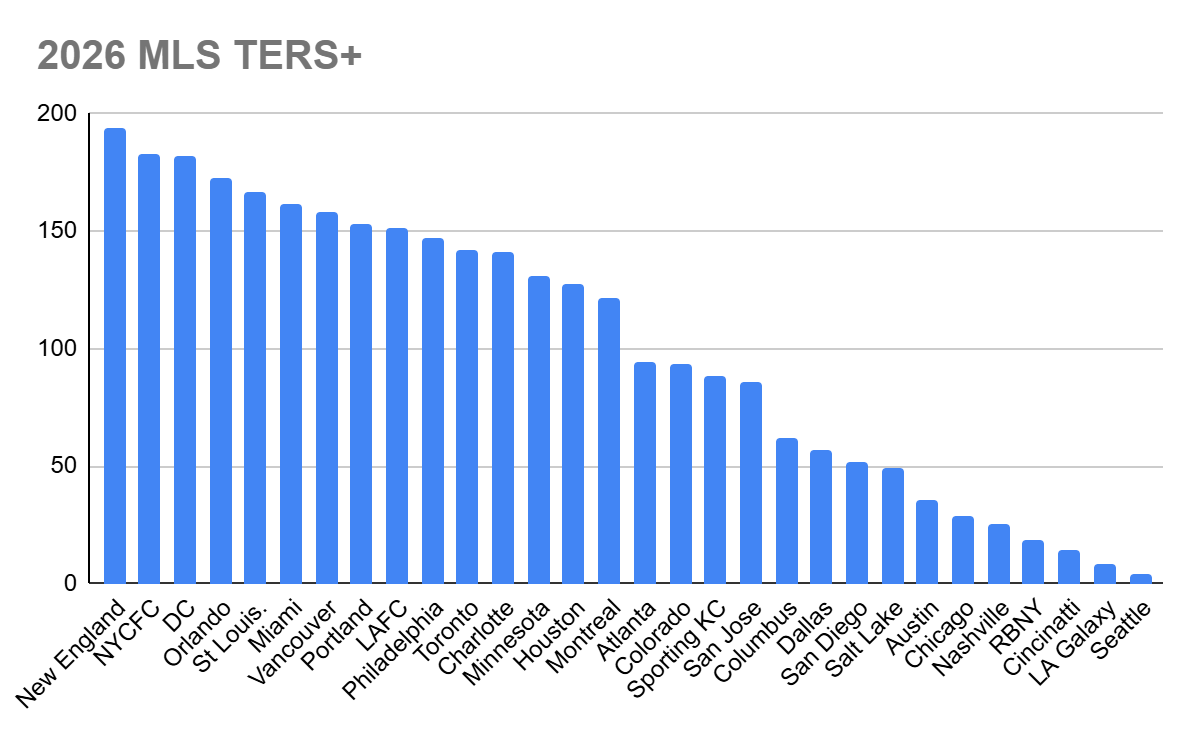
Seattle find themselves in the 2.23rd percentile of standard-deviation Top-End Roster Stability, a TERS+ of 4. The only team even in the same neighborhood of Seattle’s roster inconsistency in 2026 is the LA Galaxy, who are at a TERS+ of 8.
New England leads the way in MLS, with their top-5 outfield players by minutes played averaging nearly 87 minutes per appearance. The average MLS roster has a TERS of 81.12, more than six minutes higher than Seattle’s figure of 74.92.
It’s important to note that there is no direct correlation between TERS and winning games, it simply tells you how much rotation a squad is undergoing amongst its most crucial players. Rather impressively, the current Supporters’ Shield leaders Nashville SC sport a well-below-average TERS+ figure of 25, a testament to the depth and versatility of BJ Callahan's squad.
To summarize, Seattle has gotten less use out of their normal cast of characters than any other team in the league, and it isn't close.
While some teams in the league like Nashville have a low TERS voluntarily due to a reliable list of rotating stars and role-players, Seattle has been forced into this situation.
An example of this is a couple of positions where Seattle has become accustomed to consistency: holding midfield and center back. Cristian Roldan has been one of the most consistent players in club history by minutes played, and doesn't even make the top five in Sounders minutes in 2026. Seattle also doesn't have a center back represented in their 2026 top five, which is generally a position dependent on reliability and long shifts.
If Seattle’s TERS placement within the league doesn't convince you this injury crisis isn't merely a flash in the pan, the club's year-by-year TERS since 2009 also tells a story of never-before-seen rotation.
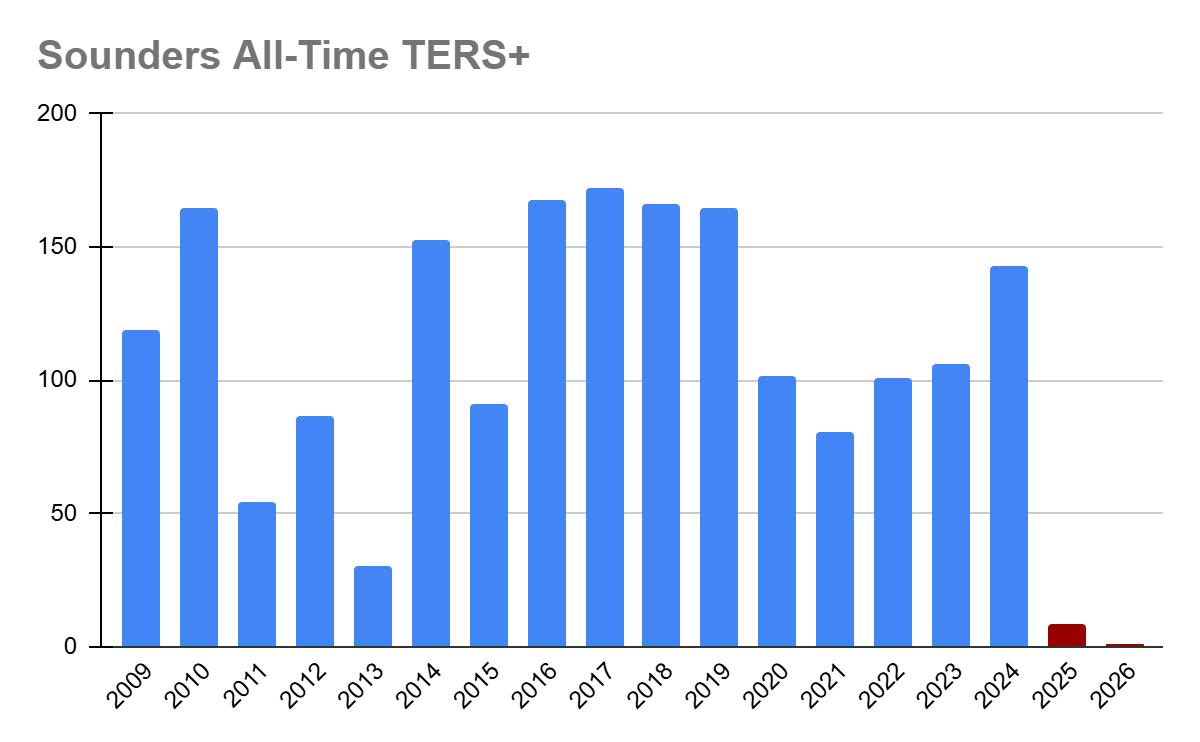
I’ve colored the teams' 2025-2026 TERS+ red on this graph, simply because if I didn't, I’m not sure anyone would notice that the figures are even present.
And of course, with Rothrock’s injury, the 2026 figure is likely to drop even further.
The last two seasons have been anomalous for a franchise that has generally benefited from long-serving and reliable names on the team sheet. Ozzie Alonzo, Cristian Roldan and Nicolas Lodeiro, just to name a few.
Over the Sounders' first 16 seasons, their TERS only dropped below 80 once, in 2013. Over their last two seasons, Seattle has set back-to-back record lows in TERS, each of which decreased the previous record by a full 2+ TERS.
In 2025, Seattle was able to hide its roster chaos behind storylines of depth, vast academy talent, grit, and a Leagues Cup title.
There has been nowhere to hide in 2026.
As the Sounders reach the four-month mark without a victory, the spotlight is shining week in and week out on who Schemtzer will put on the field, and what options he even has.
Seattle’s 2026 TERS of 74.92, when measured against the franchise's historic TERS average of 82.32, spits out a TERS+ figure of 1.
1 on a scale of 0-200. A 0.46th percentile figure.
That is nearly 2.8 standard deviations from the mean, and for those of you who also took intro to statistics their freshmen years of college, you’ll know that a figure 3+ standard deviations from the mean indicates an outlier that calls into question the reliability of the sample itself.
The more I look into this, the more I become convinced that Schmetzer is absolutely right in wondering whether the cause of this injury bug is something within the organization.
What that may be is a much more complicated question. Training methods, workload management, and tactical intensity could all play into this.
All I know for sure is that it’s getting to the point of total statistical outlier.