How do you measure something qualitative or broadly abstract?
In September, Sounder at Heart’s Adam Race attempted to answer that question, measuring the Sounders’ roster stability and injury crisis relative to the rest of the league by inventing a new statistic: Top End Roster Stability, or TERS.
In his words, the “intent of TERS is to measure the average availability/health of a team's 5 most-used outfield players throughout a season. It does not specifically account for injuries and can also be affected by a team that simply has a lot of squad rotation.”
By converting TERS to a Z-Score — or in layman’s terms, a number that represents the likelihood of something happening — you get TERS+. This stat allows you to directly compare other teams together to determine who has the most stable health and therefore Starting XI. I’ll let you read Adam’s own explanation as to how it works, the formulas, and how to interpret the data.
TERS is great for approximating its intended purpose. The more I dug into this kind of stat, though, the more I asked myself more questions.
I asked myself: This doesn’t capture player quality — such an intangible concept! How could it be captured?
TER$
That question brought me to TER$, or Top End Roster Stability & Spend. Simply put, TER$ uses player salaries as a proxy for player quality. It is absolutely not a perfect parallel. In MLS — a salary -apped league — it tends to be an OK approximate, especially over an average.
Rather than using raw minutes, TER$ uses salary-minutes. It’s a very simple concept: The minutes a player is used for is multiplied by their guaranteed salary. If Player A makes $100,000 and plays 2,500 minutes, their salary-minutes is 250 million. It’s just a way to weight the minutes your core players were used for against their quality.
Salary is capped at the maximum budget charge for each season in TER$ calculations (in 2026, that value is ~$1.8M) to prevent outliers like Messi and Son from skewing data drastically.
So, why is TER$ useful?
Imagine 5 Peter Kingstons, making $113,000 a year played the most minutes on your team at 2,500 each. On another team, 5 Hany Mukhtars making $5.4M played the same minutes, also top 5. TERS would tell you that because the most used players were available the same amount, they had the same roster stability and no injury crisis concerns.
While it’s not perfect, adding a salary factor tells you that Hany is a much better player than Peter, and TER$ would tell you that Team A has a much, much lower roster health than Team B does. Team B is probably in close to perfect health, while Team A is probably having a massive injury crisis if their most used players are making next to nothing.
Something still was bugging me: Sports are about winning and results, and without that context, TER$ isn’t super useful on its own. We can judge a team’s health and the quality of their core players for the season with TER$, but how do we know if they under- or overperformed the situation they’re in?
TERP$
These acronyms are getting long, but bear with me.
Top End Roster Points, Stability & Spend, or TERP$, takes that salary-minutes number for TER$ and divides it by the total points a team has earned, hence the “position.” Sure, the acronym isn’t great but I thought it was important to keep the root of TER to make it clear these stats are part of a “family” of stats.
By adding points, we can weight a team’s health and stability with its performance. If a team is in an injury crisis and keeps winning, TERP$ should tell us that they’re probably overperforming based on their situation, and vice versa.
After looking this over, I asked myself one last question: Does this make sense? Should a team have expected to be as good as they were based on roster stability, the quality of the healthy players and the points the team earned?
TERP$+ Differential
This one’s a little heady.
Remember earlier how I discussed TERS+ was essentially a unit-less measurement — that lets us compare teams directly? Each of these other stats I’ve mentioned also have + variants, which is how I’ll contextualize each stat with the Sounders’ performances and at the league level.
TERP$+ Differential takes the unit-less measurement of TERP$ and subtracts it from TER$, giving you a difference. It’s the difference between a team’s performance and their quality.
A positive value tells you that a team should not have been expected to perform the way they did based on their roster stability, the quality of the healthy players and the points they ended up earning. A value close to 0 means they performed roughly how they were expected to, and a negative value means they performed better than they should have been expected to, all things considered.
It’s all-important, because it essentially answers the question of “If every team had the exact same amount of injuries to the same quality level players, did we do better or worse than they would’ve?”
Key Questions
Before we begin to take a look at these stats, let me frame them with the question you should ask yourself when looking at each one.
TERS+: How stable is a team’s “core” over a period of time (we’ll just be looking at full-seasons)
TER$+: What’s the quality of a team’s “core”
TERP$+: Is a team under or overperforming their true level based on their quality and health of its “core?”
TERP$+ Differential: Should a team have expected to perform the way they?
Evaluating the Sounders’ Recent Years
Let’s take a look at the TERS stat family with respect to the Sounders’ recent years to help understand how these stats work.
How Healthy Were They?
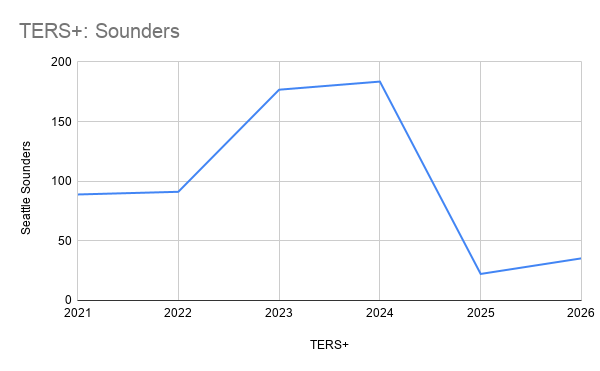
This chart shows the Sounders’ core stability over every full season since COVID. A value of 199 tells you a team is more stable/healthy than league average, 100 is bang average, 1 is an injury crisis relative to league average.
With context, it tells a roughly accurate story: In 2021, the Sounders were slightly below average in health, but key high-quality players like Raúl Ruidíaz, Cristian Roldan, and João Paulo were healthy and played a lot. 2022 was similar — Lodeiro was mostly healthy as was Albert Rusnák — those kept the number where it was. 2024 was a mostly healthy year for the most essential players on the roster — Rusnák and Jordan Morris, especially.
2025 and 2026 are far below league average — both years having large amounts of injuries limiting the availability of their highest quality players.
How Good Were the Healthy Players?
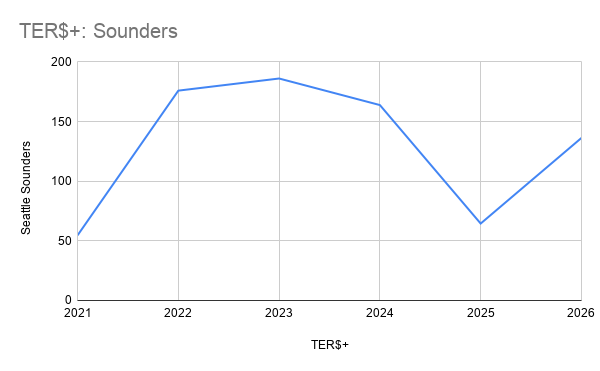
TER$+ uses the same 0–200 scale. 199 tells you a team had its highest quality players available almost all the time, 0 tells you their highest quality players were available infrequently — all relative to league average (100).
This contextualizes some of those inconsistencies from TERS+. In 2021, it shows us how Seattle’s most expensive players — Lodeiro for instance — were almost never available and therefore despite having a core of players available frequently, they were actually worse off relative to league average when it comes to top-end roster health.
2023 was a peak. The Sounders’ most expensive players were available often — well above league average — while 2025 was below average on the health front. We remember that crisis well, continuing throughout the summer with players like Kalani Kossa-Rienzi, Georgi Minoungou, Danny Musovski and others all stepping up to fill holes.
Did The Team Under or Overperform?
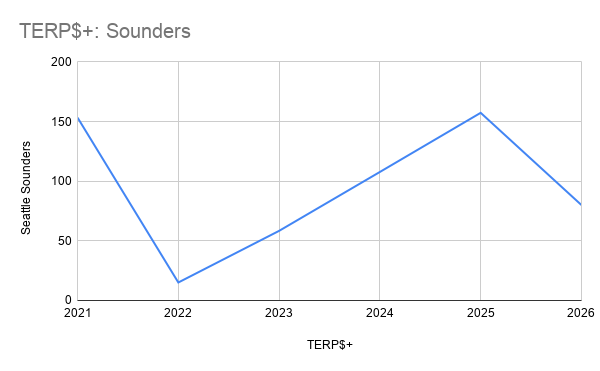
TERP$+ also uses the same scale. 199 means that a team over-performed their true level, 100 means they met their level, and 1 means they underperformed their true level.
This makes a lot of sense when looking at past seasons.
2021 had some bad injuries to key difference makers Lodeiro and Morris; so much so that Brian Schmetzer switched formations for almost the entirety of the season for the first time ever. With their best points total in years (60), the Sounders clearly overperformed that season.
2022 was a low. Injuries to João Paulo and Obed Vargas were a large part of what led to the club’s worst regular-season finish ever by missing the playoffs, but they still had other key guys health for some of the year. It’s a good reminder that that team only missed the playoffs by 6 points after winning twice in their last 11 matches, and were probably only a few games too late on sticking with Josh Atencio and Danny Leyva in midfield from making it, as no other combination made the midfield click in the latter half of the year.
2025 also shows an over-performance based on the sheer number of injuries the team had, while 2026 shows a slight underperformance — probably accurate given the extreme hot-and-colds we’ve experienced.
Should They Have Under or Overperformed?
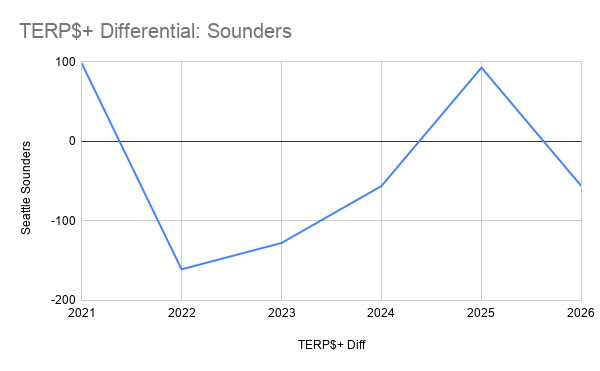
With TERP$+, 199 says a team probably should’ve performed worse in most years given their health, stability, available quality and points earned. 100 means they probably finished exactly where their situation put them, while -199 means means despite their situation, the team should’ve done much better.
2021 gives the same story as TERP$+: The team probably should’ve done worse given their situation. 2022 says they should’ve done better. In my opinion, a willingness to play other young guys in natural positions (specifically Leyva and Atencio) earns them a better position despite the situation.
2024 also says they probably should've done better. We all remember that year — a great defense, but a rough offense. Lots of 1–0 games. Them being decently below 0 says that they should’ve done a bit better based on their available “quality.”
This is one of the seasons where its a bit of a misconception — having older, ineffective players playing a ton meant that Seattle had a lower ceiling because they were paying for what a player did in the past — kind of like what’s happening with Rusnák now; giving him a high TAM deal to keep him around while he’s still good, even if it means that the club gets less for their money when he declines.
2025 also shows that they probably should’ve been expected to perform worse than they did given the injuries — validating just how bad we thought the crisis was.
2026 shows as an underperformance of team level given the circumstances. I think it’s pretty fair to say that for a club that had never lost 8 straight matches and had started the season 7–1–3, it was pretty unlucky to have the summer they did. If they could replay the winless streak 10 times, they probably have at least a few more points in 9 or 10 of them — even despite the injuries to critical players.
With an understanding of how these stats can bear out on a team level, next time I’ll take a look at how the TERS stat family can be used on a league level, answering some questions like:
- How do the Sounders perform compared to the rest of the look with respect to health and quality?
- Who has been the healthiest/most stable and vice versa?
- Who has consistently over/underperformed their true level the most?
- What does a Supporters' Shield and M?LS Cup winning team look like in terms of health, stability, performance and quality?